
Internet research teaches us that people don’t read a text, but scan it. Fonts, pictures, and charts are used to highlight important ideas. A hundred years ago, Soviet avant-garde artists were also looking for a special way to convey ideas through color and shape so that the audience would remember them. The audience was not in such a hurry as it is now, though.
Here I want to talk about one of the avant-garde movements: projectionism. I found out about it by accident while strolling in a gallery. Projectionists used to analyse art, and so they created data visualizations to illustrate their research findings. They also experimented a lot with color and composition. Back in those days, data design didn’t exist in the Soviet Union; IZOSTAT, Institute of Pictorial Statistics, emerged years after projectionism. Projectionists were artists, not statisticians, and that’s what caught my attention. How and for what did they create accurate data visualization sketches? Mrs. Liubov Pchelkina, expert in projectionism, pointed out that projectionists were researchers and eventually their drafts and analytical material were more important for them than the finished pictures.
Sounds promising, doesn’t it?
Projectionists
The new life is in your heads, not in the chairs you’re making!
In the first quarter of the twentieth century, bourgeois arts were declared anachronistic. Paintings and sculptures that had been created to please the aesthetics were of no value to the new government. But just ruining the old world was not enough: it was necessary to create a new artistic reality. The avant-gardists worked at the forefront of this front. Some of them tried to give the society those concrete, ideologically correct and practical things it asked for. Those artists were later known as Constructivists. They laid the foundations for industrial and textile design, decoration art and posters.


Along with the constructivists, the creative group “Method” emerged. Its members agreed with Constructivists that art for the sake of beauty and inspiration is an outdated concept. But they also believed that traditional art shouldn’t be abandoned, and that creating routine objects wasn’t a task of value to the artist. Solomon Nikritin, a member of the “Method” group, came up with the new art concept: “Projectionism,” or the projection system of thinking. Projection is something directed towards the future; if a thought is sent via picture, the viewer can develop it. The viewers’ active role was crucial: reflecting on what they saw, they would become an “improved version of themselves”. The artist communicated ideas with their own method i.e. a combination of materials and specific features, which they developed on their own.
The Method
In an ideal society, everyone in his place should be a creator.
— SolomON NIKRITIN
Two important processes boosted the creative activity of the Method members. The first was industrial development and electrification. The second was the development of new directions in philosophy and sociology, which attempted to comprehend the new reality. Nikritin was inspired by ideas that the world consists not only of matter and energy, but also of an organizing force, which stimulated creating works of art from raw materials.
Art became a scientifically grounded method of working with reality for Nikritin and his followers. Projectionists did not care too much about uniting around manifestos and about creating finished objects, but appreciated the search and the creative process.


of the Republic of Kazakhstan. Source.
Leonardo da Vinci was an idol for the projectionists. They wanted that art develop along with new scientific knowledge, and that the artist be a “one man army.” They studied physics, chemistry, philosophy, musical harmonies as well as art theory. They experimented with color, shape, and other means of expression and closely followed scientific and technological progresses to find the formula of the ideal painting through mathematical and real-life evidence.
But when there is no end point, as in communism, which the projectionists had welcomed, it is not clear where to go. Even more so, when there are no concrete work criteria. What the projectionists did was not about setting spiritual and moral guidelines that could instantly find application in everyday life. It was a flight of thought, an attempt to tell about something important, and not at the level of one’s own feelings but with scientific evidence. In the late 1920s, this activity, like many others, began to be monitored and “tested for usefulness.” Companions of Solomon Nikritin gradually left for other artistic directions. The art was too difficult and vague for the average proletarian, at least new authorities believed so. After some time, the projectionists were recognized as ideological aliens, and they were not taken to the future. Ironically, the projectionists wanted to get there the most! Many of the projectionists had to choose other art movements for self-actualization. Nikritin decorated palaces of culture and theatrical scenery for the rest of his life.
Projectionists and visualization
I am looking for beautiful sounds of a number, the highest harmony, the highest clarity and the highest duration and surprise.
— SolomON NIKRITIN
Projectionists have painted quite a few pictures, but visualization was in another part of their work: research. Since they walked an unbeaten path, they strove to streamline and systematize the available knowledge, for themselves, their colleagues and students. Graphs and charts have proven to be a convenient way to display both theoretical concepts and practical experiments.
At the same time, projectionists cared little about the ease of interpretation (i.e. UX). At one of the exhibitions, they hung their works on huge sheets of paper, put a stepladder to them, hung a magnifying glass and announced: “If you want to understand the drawings…Spend two hours.” It was important for them to convey the idea through some universal method, but who said that the understanding of this method and the idea itself should be simple? One cannot become the better version of himself without an effort.


Anniversary of the Museum of Painterly Culture / Exhibition catalogue: [Pchelkina L.R., Kochergina I.S.] Tretyakov Gallery. Moscow, 2019. P.55.
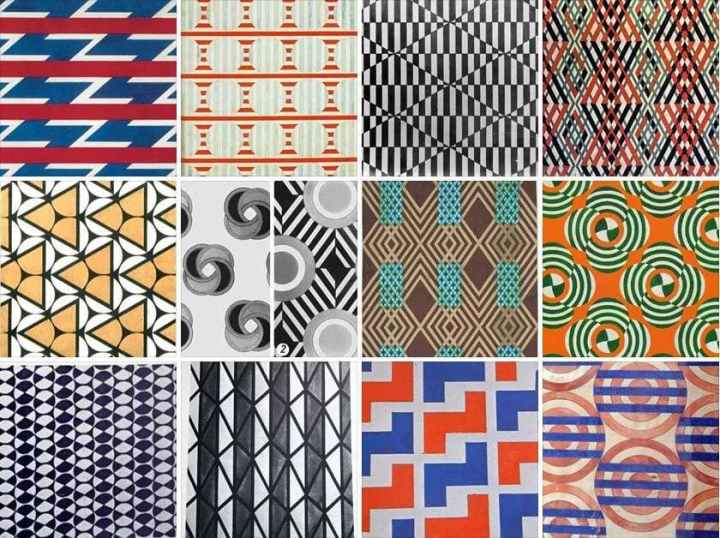
In data analysis it is often said that “You can’t improve what you can’t measure.” The projectionists were well aware of this: they measured and recorded all their activities. They put a modular grid on paintings reproductions to study the color construction system. They researched human biomechanics to improve production efficiency of workers in factories. They collected data and studied it.
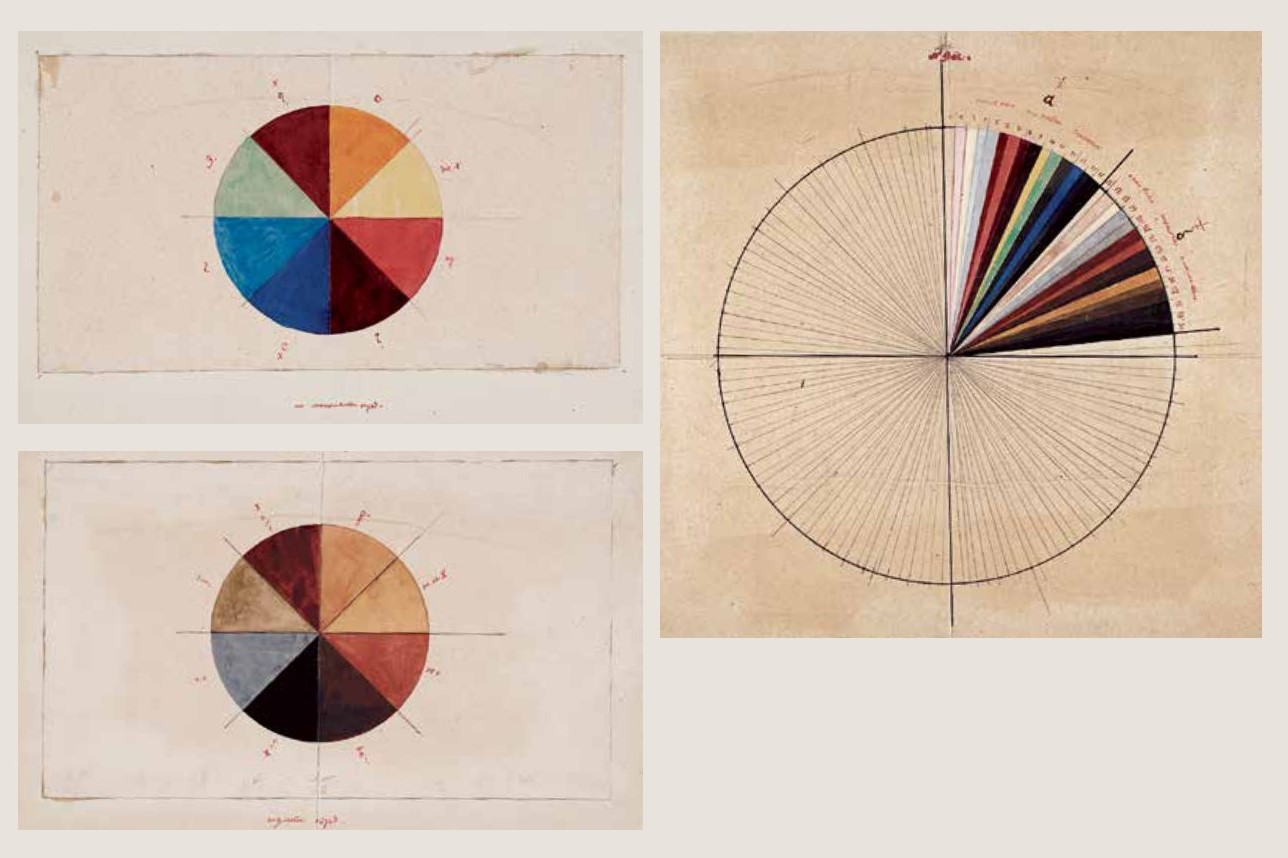
It’s a tricky question whether projectionists were first analysts, then artists, or vice versa. In any case, Nikritin was the head of the Analytical Office at the Museum of Painterly Culture. He studied how to analyze a work, how and why it affected the viewer, and looked for patterns: repeating elements, trends, interconnections etc. Numerical ratios were of particular importance to him. With their help, it was possible to choose a harmonious visual form that is effective for a specific situation. Nikritin was especially interested in the color and sound interconnection. The second series of drawings below is devoted to the comparison of the color spectrum with the system of musical harmonies.

[Pchelkina L.R., Kochergina I.S.] Tretyakov Gallery. Moscow, 2019. P.57

Gallery. Moscow, 2019. P.59.

Of course, projectionists were not the true first data designers. They wanted to help a new Soviet man appear, not create blueprints to quickly explain any statistics to as many people as possible. But some of their experiments to find this universal method turned out to be very similar to how data are presented today.
So, what do projectionists and visualizers have in common?
If you’ve read so far, you’re probably wondering what’s common between the projectionists’ and data visualization’s principles. Read on. Projectionists would definitely not be taken to the future, where speed and simplicity are often at the forefront. Although I don’t want you to think I’m against clarity and simplicity, I must say not all topics have depth.
But let’s get back to the point. What is common between the projectionist approach and the principles of data visualization:
– bringing different sources together, knowledge compilation
– attention to numerical proportions that affect the perception of the picture
– organization of scattered matter to express the projection
– the desire to raise the intellectual level of the viewers, make them reflect upon the seen
– expression of an idea through an organized system of color, shape, texture (method)
– many approaches for creating a work, freedom of expression
– scientific research method
– search for different data sources to provide a more complete picture
– the audience-oriented approach
– organizing raw data into a system to prove a hypothesis
– encouraging the reader to ask questions or take an action
– encoding numerical data by color, shape, number of pictograms etc.
– using the most suitable charts for each specific case
– following the rules for working with data
There is a type of visualization which doesn’t hand you an idea on a silver plate, but is rather a canvas that you want to examine and dive into. The latter requires effort to be created, and it runs counter to the accelerating reality. It was with such a dilemma that Soviet avant-gardists faced a hundred years ago. They tried to find a formula for a greater harmony for a wonderful new world, and it’s curious that it were them, not practical constructivists, to bring data visualization to life and make it art. What artists do you know who tried to use a data-based approach in their artworks?

Liubov is a dataviz lecturer at the Higher School of Economics, with a MA in data journalism, and author of the call_me_data project. Liubov loves finding data stories in art and literature.
-
Liubov Popovetshttps://nightingaledvs.com/author/liubov-popovets/


