
This is the fourth installment of a yearlong data visualization journey. If you want to read the third part before jumping in, here’s the article about my work-themed data collection!
For this set of four weeks, I wanted to pick a type of data that would balance out my previous visualizations about work and allow me to focus on something other than productivity. I decided on entertainment. In order to begin understanding my own entertainment landscape, I collected information about sources of entertainment for the first week.
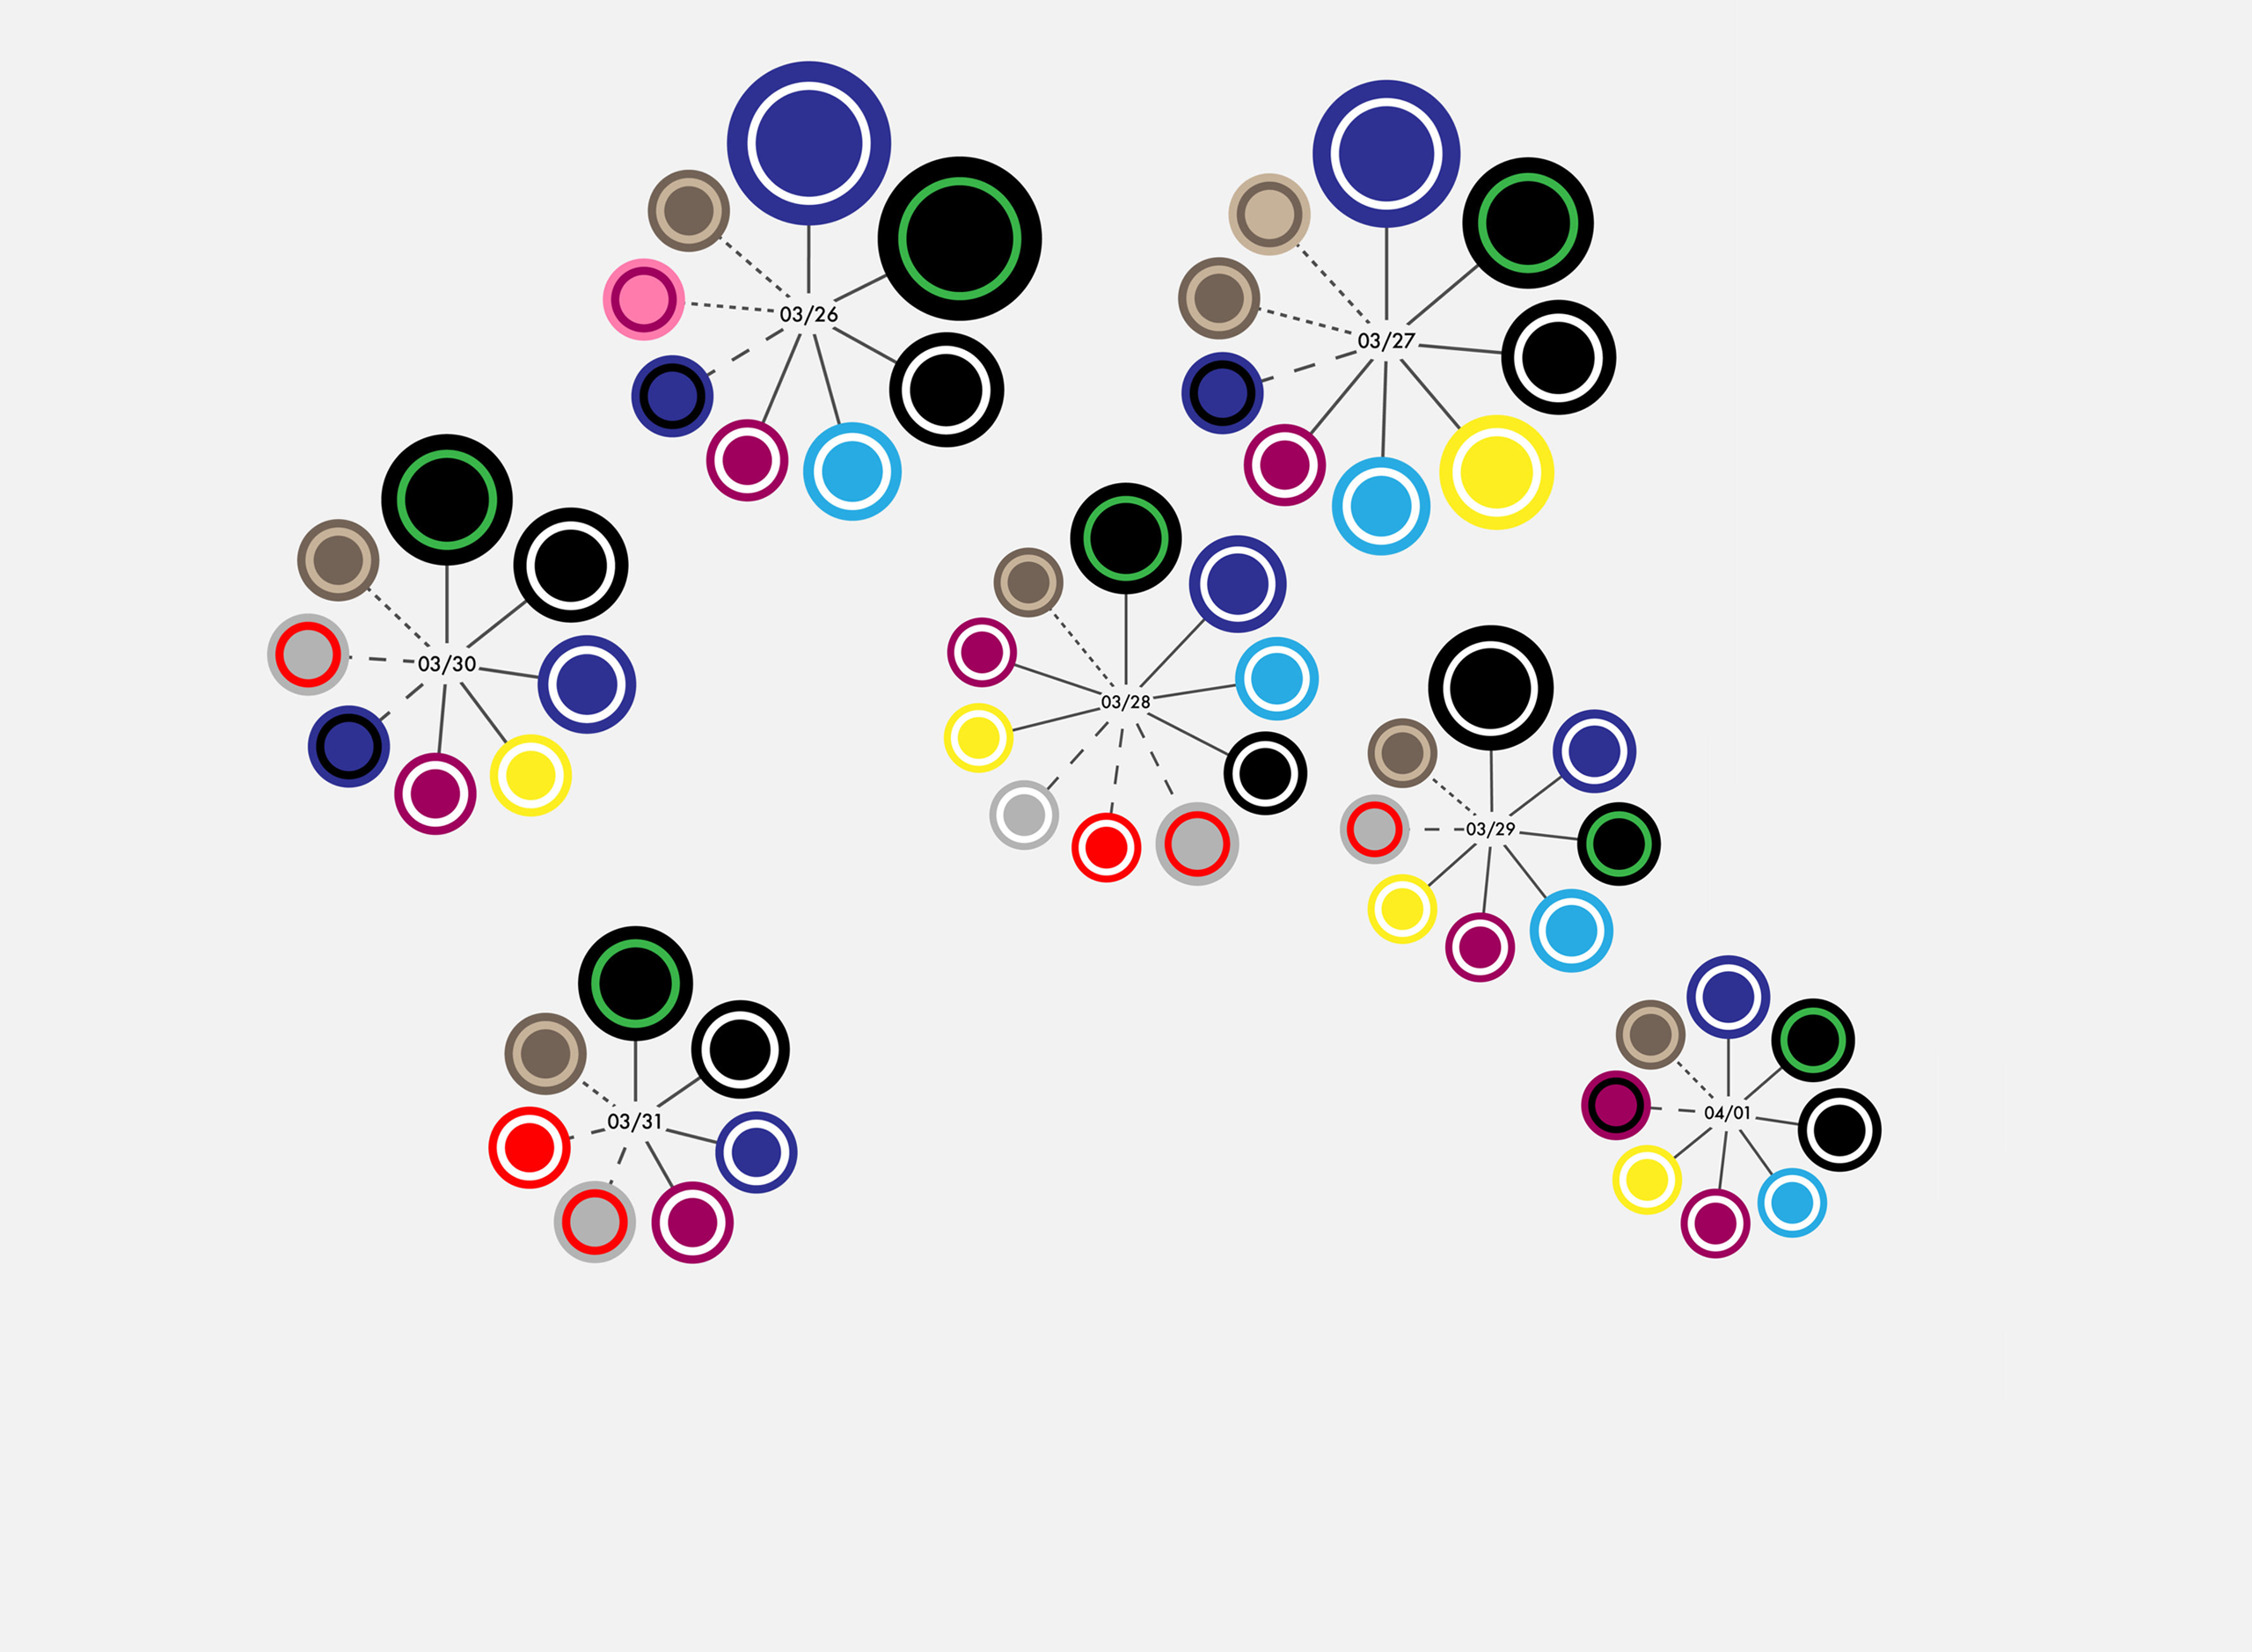
Collecting this data consisted of making a tally mark in a chart every time I used each entertainment source because I wanted to get a sense of the frequency with which I used each platform. I don’t often think much about how many places my entertainment comes from, so it was surprising to me what a wide variety of games and other media I engage with each day. However, there was an obvious depletion of variety as my data collection continued. Each week, I begin collecting data on Friday and continued through the following Thursday, so the first three days of data (03/36-03/28) were weekends, when I had more time to relax and, therefore, entertain myself. For the other four days of the week, there was less variety in my entertainment and I used each source less frequently overall.

Beyond variety and frequency, this visualization shows how I access most of my entertainment: through my phone. Though I expected this to be the case, I was also pleasantly surprised to note that I used analog entertainment at least once a day, often by reading, but sometimes by playing a board game or painting.
After seeing the sources of my entertainment laid out, I wondered how I chose between such a wide variety. This prompted me to write down why I decided to use each form of entertainment I engaged with for the following week.
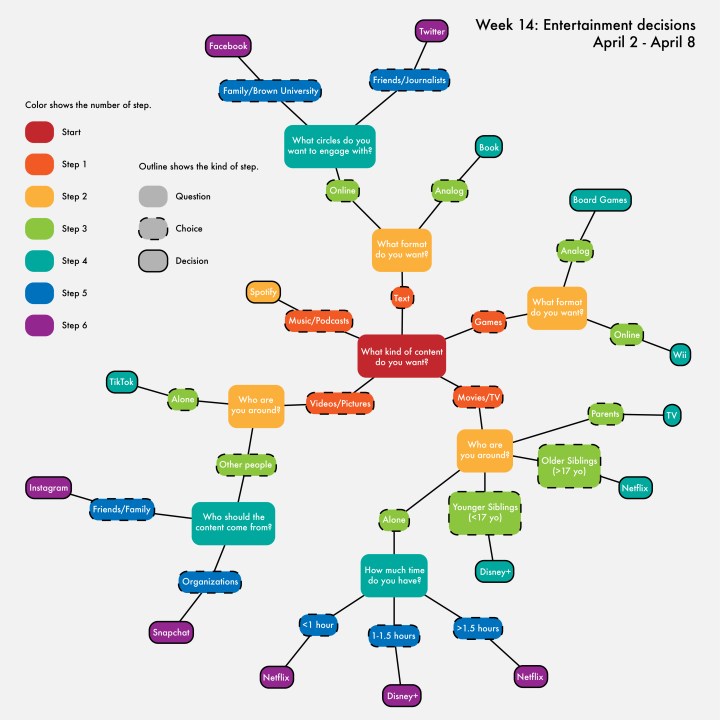
Based on my observations, I created a decision web showcasing how I choose what media or entertainment to use. I found that much of my decision-making process was based on the content medium, so that is the center of my web. From there, I asked myself questions about more specific criteria, like who I’m with, who the content comes from, and how much time I have. Each combination of choices leads to an entertainment source. When I came up with the idea for this visualization, I was concerned that I would have to squeeze a ton of questions into a (relatively) small space, but was shocked when even the most involved decisions only took three questions to surface a conclusion.
Although I enjoy finding insights into my own habits, I thought it would be interesting to widen my gaze for the third week and explore how I shared entertainment with other people in my life.

With this visualization, I wanted to emphasize the different sets of people I shared entertainment with, all of whom live at home with me. Based on my viz, I most often share with three of my sisters: Liza, who is two years older than me, and Talia and Nola, who are eight and eleven years younger than me, respectively. Interestingly Zane, my younger brother, is most often the person with whom I share social media posts. A factor that impacted this data was the fact that my dad and sister Anya were out of town for a portion of the week in order to visit colleges. Since they weren’t in the house, I couldn’t easily sit down to watch a movie or share other media with them, thus they were absent from the dataset. Overall, I wanted this visualization to convey togetherness, represented by the blossoming flower format.
As I approached my last week of entertainment, I realized that though I had painted an excellent picture of the culture and habits around my entertainment, I hadn’t actually tracked the content of the media I was consuming. Music is the most pervasive type of entertainment in my life, so I set out to track the genres of music I listened to for the week.

Much like the previous visualization, the symbols of this viz were inspired by objects in the world: this time, records. Each record is a song I listened to and is grouped with others in its genre, determined by the artist of the track.
I wanted to show who chose the music because there were two events throughout the week when someone other than myself was in charge of the music, a household dance party to celebrate my sister’s birthday and a bonfire in our backyard celebrating the good weather. For both of those, my brother dj’ed. He has an affinity for rock and rap music, so those genres contain many blue records. On the other end of the spectrum, most people in my family don’t listen to indie or folk music, so those genres were almost exclusively played by me.
In summary, variety is the name of the game when it comes to entertainment in my life. Not only did I discover how much entertainment I have access to, but I also learned how often I share it with others. That sharing fosters connection in my life and I’m glad I took the opportunity to fully quantify and appreciate that.
Now that this set of entertainment vizzes is finished, I’ve started collecting data for the next theme: messages. If you’re chomping at the bit for more, I’m updating my personal data collection journey weekly on my Twitter, Instagram, and TikTok, so find me there if you don’t want to wait for the articles! While I continue collecting data for my next installment, I invite you to follow along or even try some data collection of your own and share it with someone. Until next time, stay tuned!

Emilia Ruzicka is a data journalist, designer, producer, and storyteller who specializes in health, science, and technology reporting. They are currently pursuing their M.A. in Media, Culture, and Technology at University of Virginia while continuing to work on freelance projects and write their own blog. Outside of data viz, Emilia loves to visit museums, make art, and talk about the USPS. If you have a project proposal, story tips, or want to find out more, visit emiliaruzicka.com.
-
Emilia Ruzickahttps://nightingaledvs.com/author/emilia-ruzicka/

-
Emilia Ruzickahttps://nightingaledvs.com/author/emilia-ruzicka/

-
Emilia Ruzickahttps://nightingaledvs.com/author/emilia-ruzicka/

-
Emilia Ruzickahttps://nightingaledvs.com/author/emilia-ruzicka/


