
Humans have long been curious about the process of dating and finding the right person. Now that we can swipe left and right on the phone when we decide whether the person is worth taking a chance or not, dating has become an even more fluid process – anywhere and anytime. We collect and compare matches in the hope of finding the “perfect match.”
But is this tireless search for the perfect match the right way to date? Is this collecting and sorting of people sustainable? And can we fall in love with a behavior like that? To explore this question, I visualized three years of online dating experiences in a calendar-based graphic.

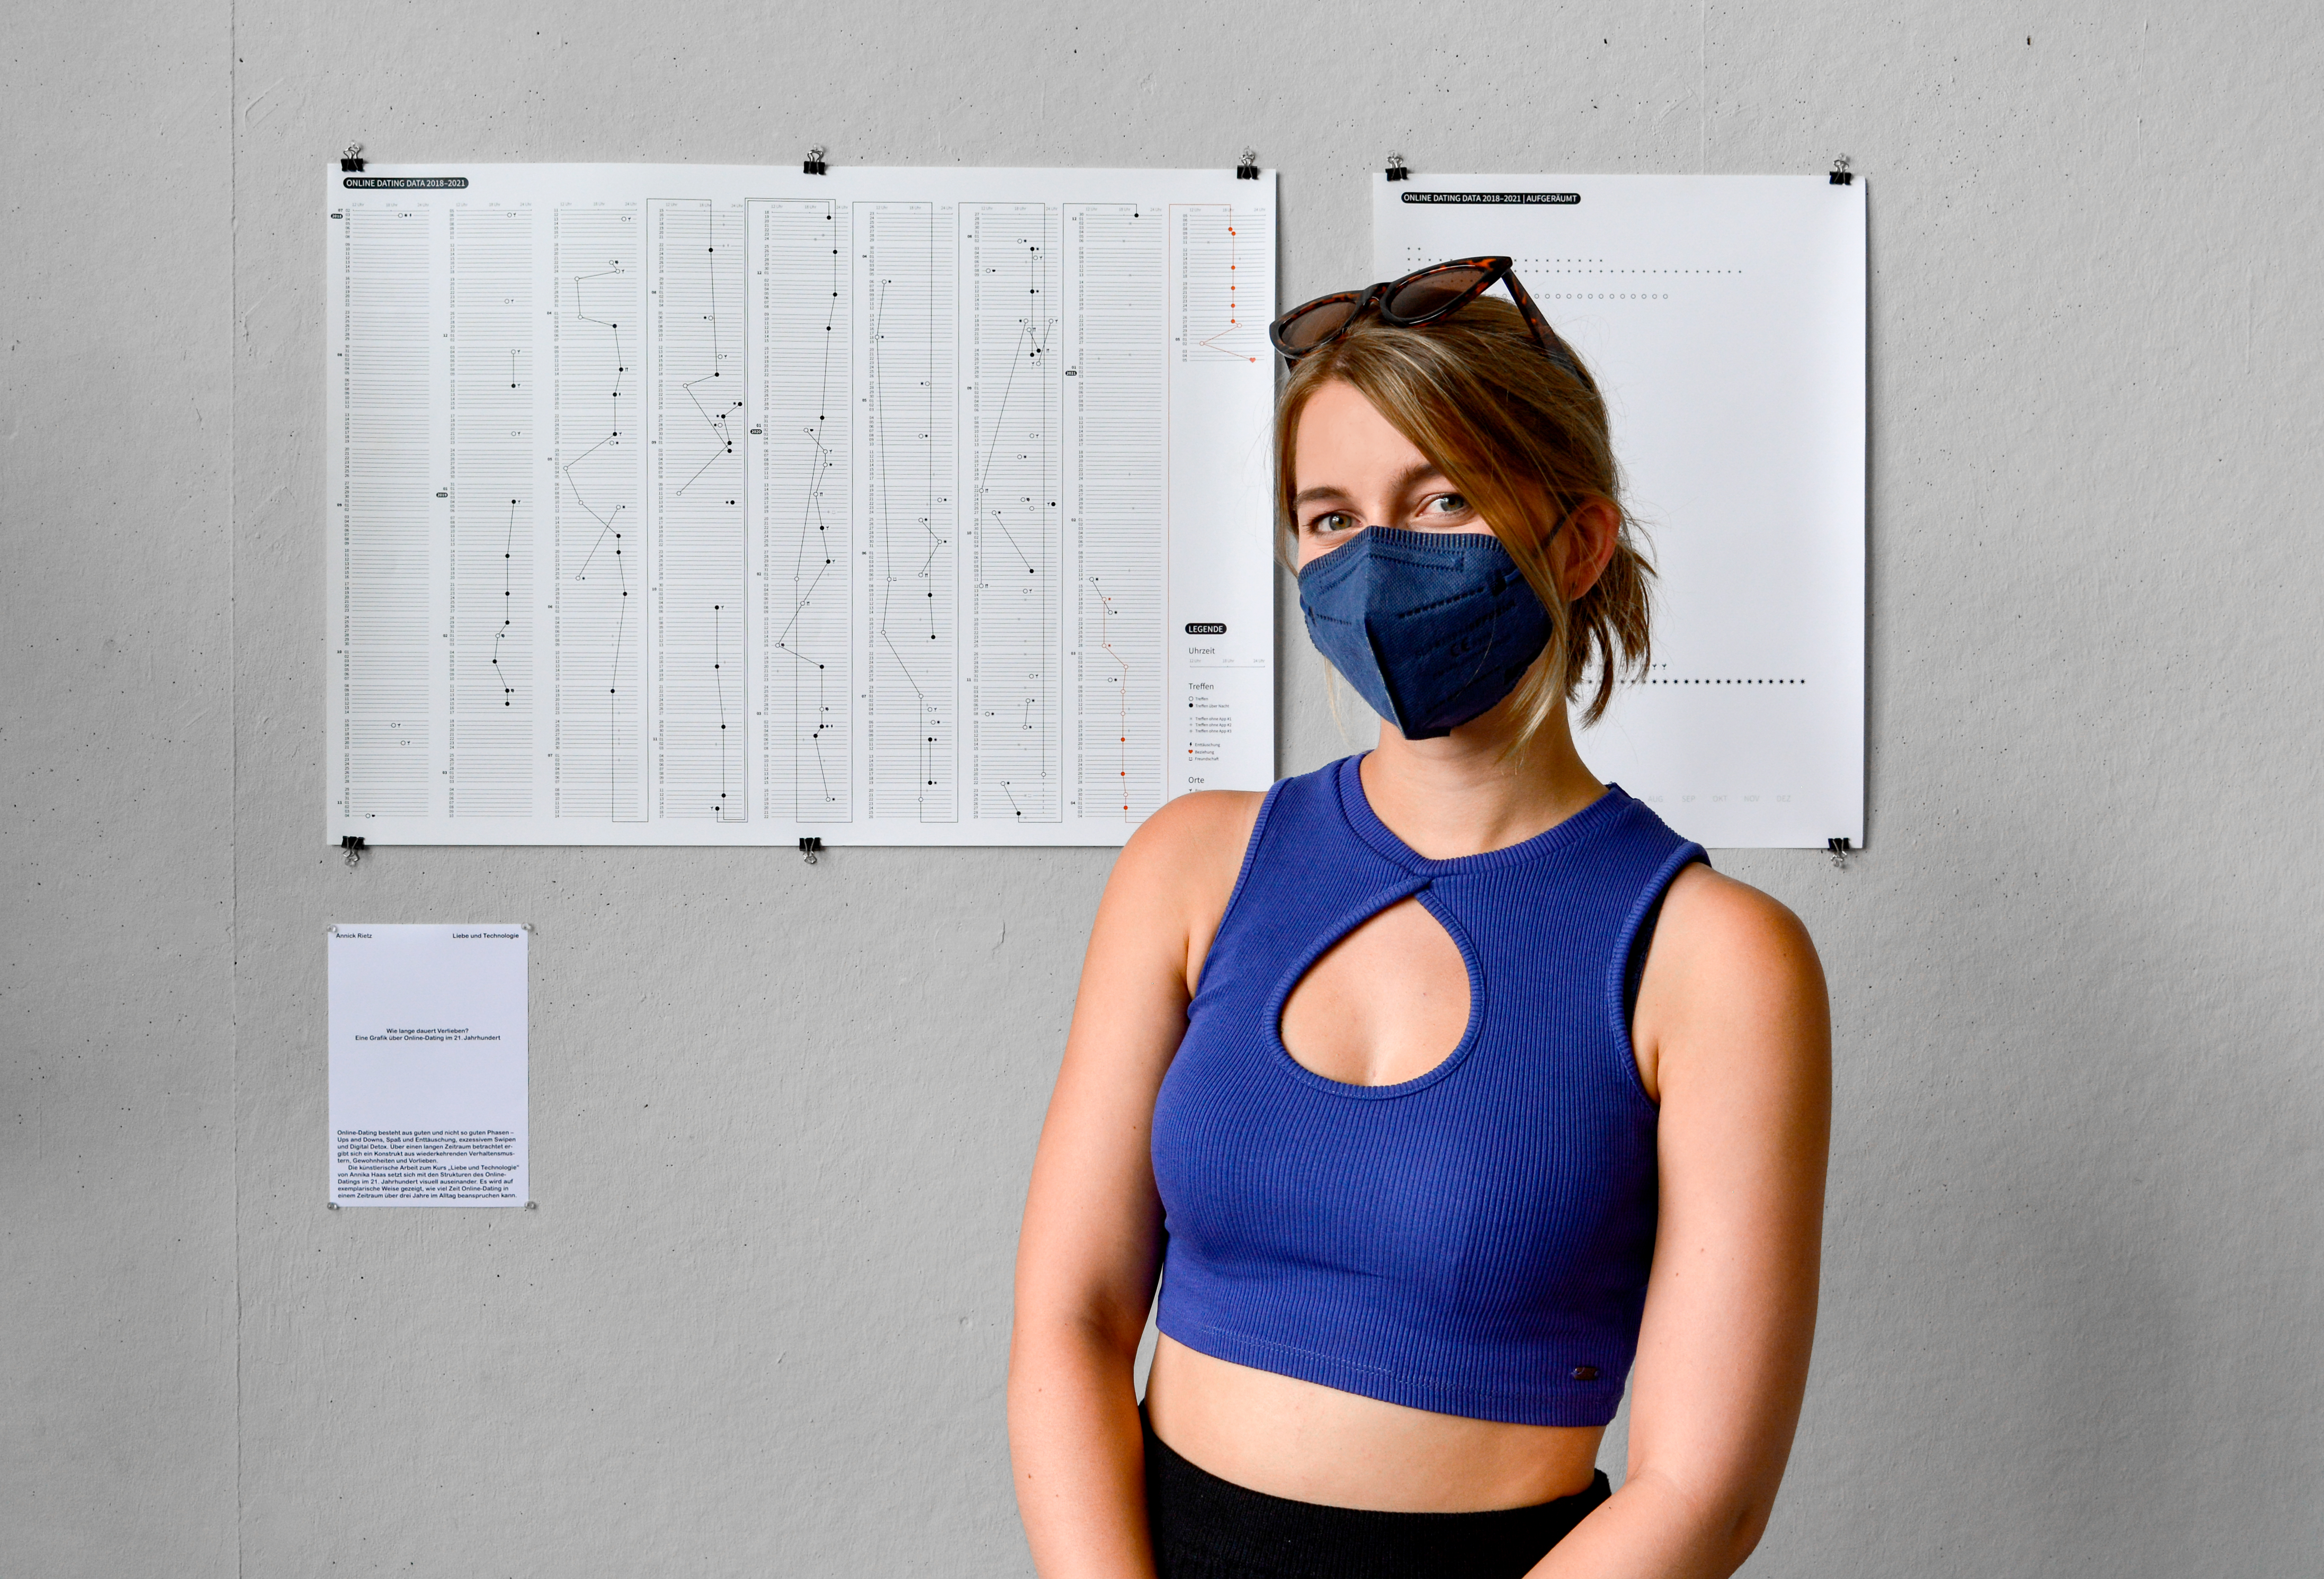
I showed how Anna B. (name changed) – a female in her 20s, living in Berlin, Germany – met new people through dating apps (in this case Tinder and Bumble) and how those emerging human interactions were structured.

In the graphic, I included information about time, location, and degree of emotional involvement. I connected strings to show dates with one person – individual circles stand for one-time meetings. If the circle is filled, the date was overnight. The position of the circle on the horizontal line of the calendar shows the time of day (starting left at 12 pm noon and going to 12 am midnight on the right side).

I created an additional graphic to show the same dating experience tidied up. This time, the same circles and symbols are lined up without any calendar structure. The graphic shows the quantity of dates (single and multiple) arranged in order of size/length. In this visualization I wanted to emphasize the comparison between the different dates. You can see how long the dates lasted – especially compared to the red string that shows the final relationship. You can also explore meeting preferences, which mostly took place outside and in bars.


Dating apps enable people the opportunity to connect like never before: a new date is waiting just a swipe away from us. But, despite their implicit promises of ease and speed, finding the perfect match seems harder than ever. This data visualization reveals how much influence online dating can have on the way you spend your time. Reviewing the possibilities can consume your “idle” time. Online dating apps help to surface the people you’re interested in, but you still have to do the work of meeting and trying to get to know someone – and that can be time consuming. Too often the depth of emotional involvement is traded off for the quantity of new dates. But what counts is the final outcome: 1,038 days. 136 dates. 49 new acquaintances. And one relationship.

Annick Rietz is a designer from Berlin (Germany) with a special love for communicating information and visualizing data. She is always up to facing the challenge of organizing chaos and solving problems in a visual way.
Currently, she is studying for her M.A. degree at Berlin University of the Arts in the class of information design.
You can find some of her work on Behance or Instagram.


