
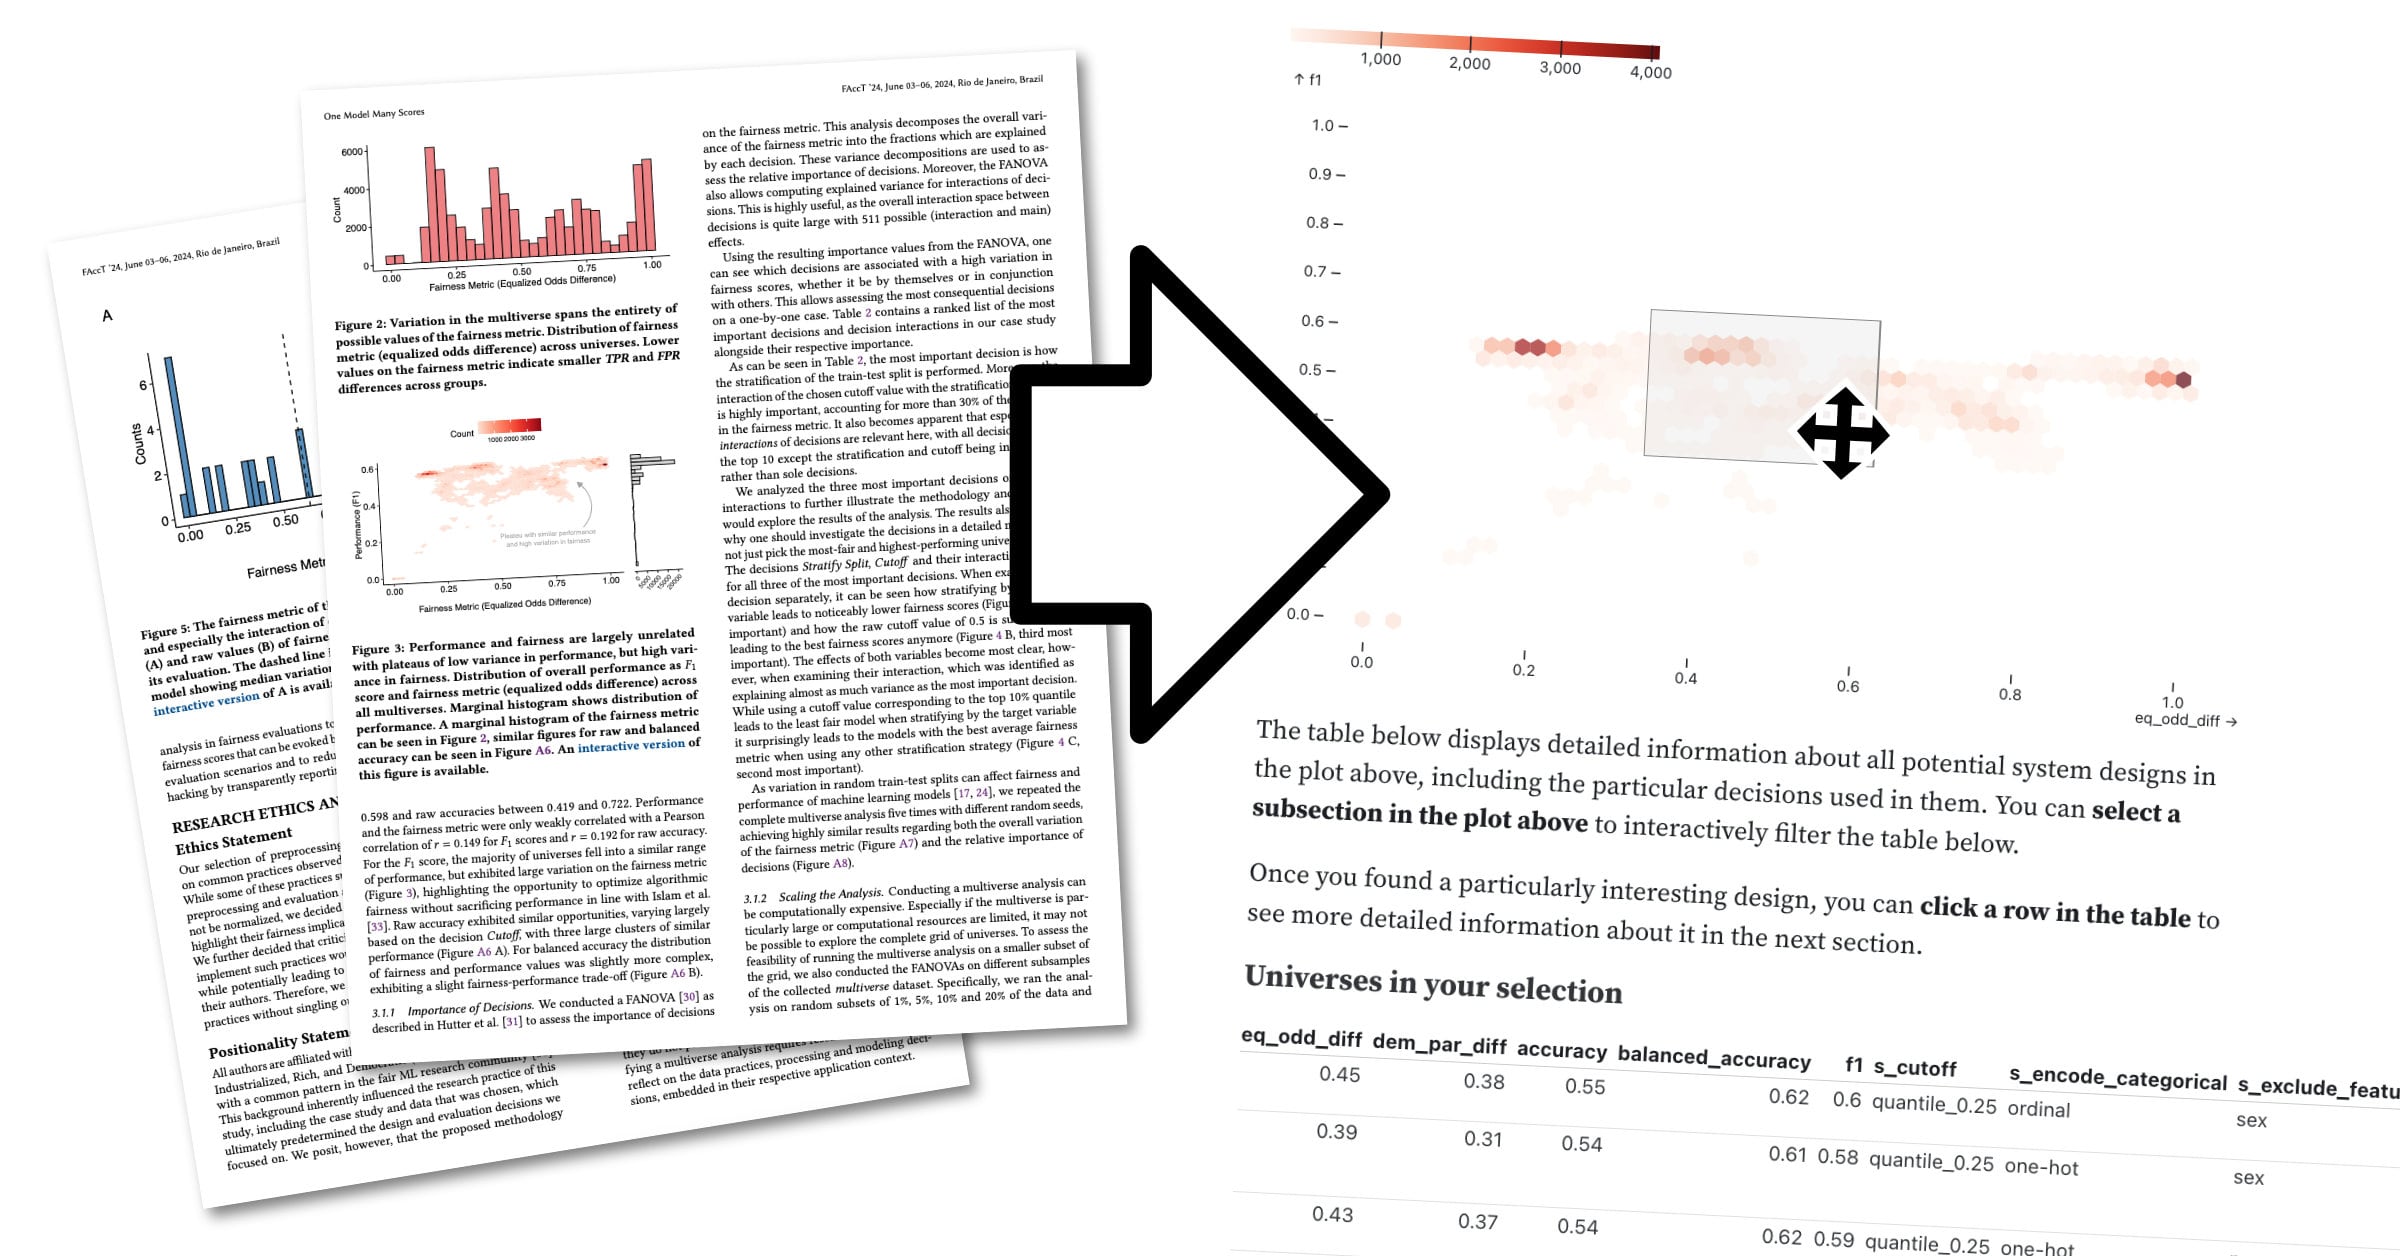
Can you make an academic paper interactive? Let me walk you through my journey of creating an interactive visualization to illustrate the results of the paper, “One Model Many Scores: Using Multiverse Analysis to Prevent Fairness Hacking and Evaluate the Influence of Model Design Decisions” written by Florian Pfisterer, Christoph Kern, and myself.
Into the multiverse
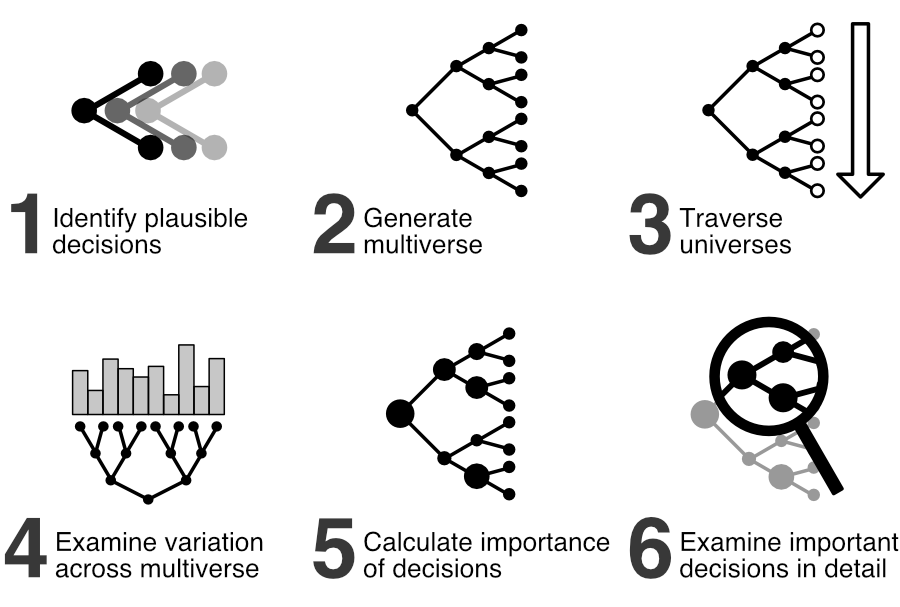
Let’s start with a summary of our research. There are many decisions to make when creating a new machine learning system: what data to use, how to process it, and many more. Researchers often might not be aware of the decision-making process and possible alternatives. In this paper, we focus on all these decisions, try to make them explicit, and combine them to construct all possible alternative universes derived from those choices. Each of these combinations of decisions creates a single potential universe and together form the multiverse. We then evaluate the impact of the decisions across this constructed multiverse. In this particular study, this led us to examine a multiverse with more than a million universes in it.
As part of the publishing process, other researchers review academic papers in a process called “peer review.” One of our reviewers asked us to provide additional information on a specific part of the multiverse but we struggled to choose which one. This brought up an idea: what if we don’t have to select any particular part but allow the reader to do this for themselves? We had planned to release the raw data alongside our paper for anyone to explore it, but we wanted to go further. So, the idea of adding an interactive analysis was born.
From idea to interactive tool
I started by sketching out how a system that allows for easy and interactive analysis of our results could look, drawing inspiration from the existing figures in our paper. I then looked into potential libraries that fulfilled two requirements: (1) native interactive capabilities since we didn’t wish to implement everything from scratch and (2) support for large datasets given that we have more than a million observations we wish to show and filter in real-time.

Mosaic, created by the Interactive Data Lab at the University of Washington, fits both requirements. I decided to pair it up with the Observable Framework–an open-source static site generator widely used for interactive projects. I looked through the list of official Mosaic examples and duplicated a visualization that resembled the one I wished to create. Then, I started tweaking it to resemble the reference figure from the paper.

Addressing roadblocks
There were two major roadblocks when creating the interactive visualization. The first issue was that, at more than 600 MB, the dataset was too large.
The second roadblock was that Mosaic didn’t support interactively selecting an entry in a data table. This feature was essential to the idea of the multiverse though, since I wanted people to be able to look into every single one of the universes within the multiverse in detail. I dove deep into the Mosaic codebase to understand how the library works and half reverse-engineered / half duct-taped together my implementation of an interactive table.

The addition of the interactive visualization was a fun project with ample opportunities to learn and try out new skills and technical libraries. Interactive data visualizations like this one add to the quality of a paper and can make the results more intuitive. Moving forward, I will be considering adding interactive visualization from the get-go.
If you’re interested in creating an interactive visualization, you can also have a look at the complete source code of this one.
Have you made an interactive data project you’re proud of? Share your “Data Diary” with Nightingale! Read our submission guidelines here

Jan Simson is a doctoral candidate in Statistics at the LMU Munich, the Munich Center for Machine Learning and the Konrad Zuse School for Excellence in Reliable AI. His research aims to make artificial intelligence and machine learning more reliable, robust, fair and open. He has previously worked as a data analyst at Picnic, a Dutch grocery-delivery startup and as a research fellow at The Music Lab at Harvard University, where he helped to develop themusiclab.org, a citizen science website for people to participate in music research. His work typically lies at the intersection of Psychology and Data Science, trying to bring aspects from one field into the other.
- Jan Simson


