
Welcome to Draw Along Dataviz!
This article is part of The Kids’ Table section on kids dataviz. This section of Nightingale is filled with mini-lessons and drawing activities so that you can do data visualization, too! Each of the activities below includes an example graph, but feel free to get creative and try out your own unique ideas. You can find extra printable copies of each activity here.
We’d love to see what you make! Ask an adult to send a picture of your favorite creations to nightingale@datavisualizationsociety.org, subject line Draw Along Dataviz, with your name and age. You might see your work showcased in a future edition. Have fun!
Taking a tasty tally
Imagine that you manage a grocery store and it’s time to take inventory. You need to know how many of each item you have in the store, and if those items are about to expire.
This sounds like a job for a bar chart! A bar chart uses rectangles of different lengths to compare quantities of things (how many?). The more things of a certain type there are, the longer the rectangle will be. You can use colors or patterns for each type thing you count—you can even use both!

This grocery store, for example, sells mostly fruits. It has four lemons, five apples, six avocados, and nine peaches. Three of the avocados are unripe, so they are marked with the striped pattern. Asfor the peaches—can you tell how many of them are unripe?
Now it’s your turn!
You can use this empty bar chart to count the items in your own imaginary grocery store. What’s in there, anyway?

It’s pie time you got a watch
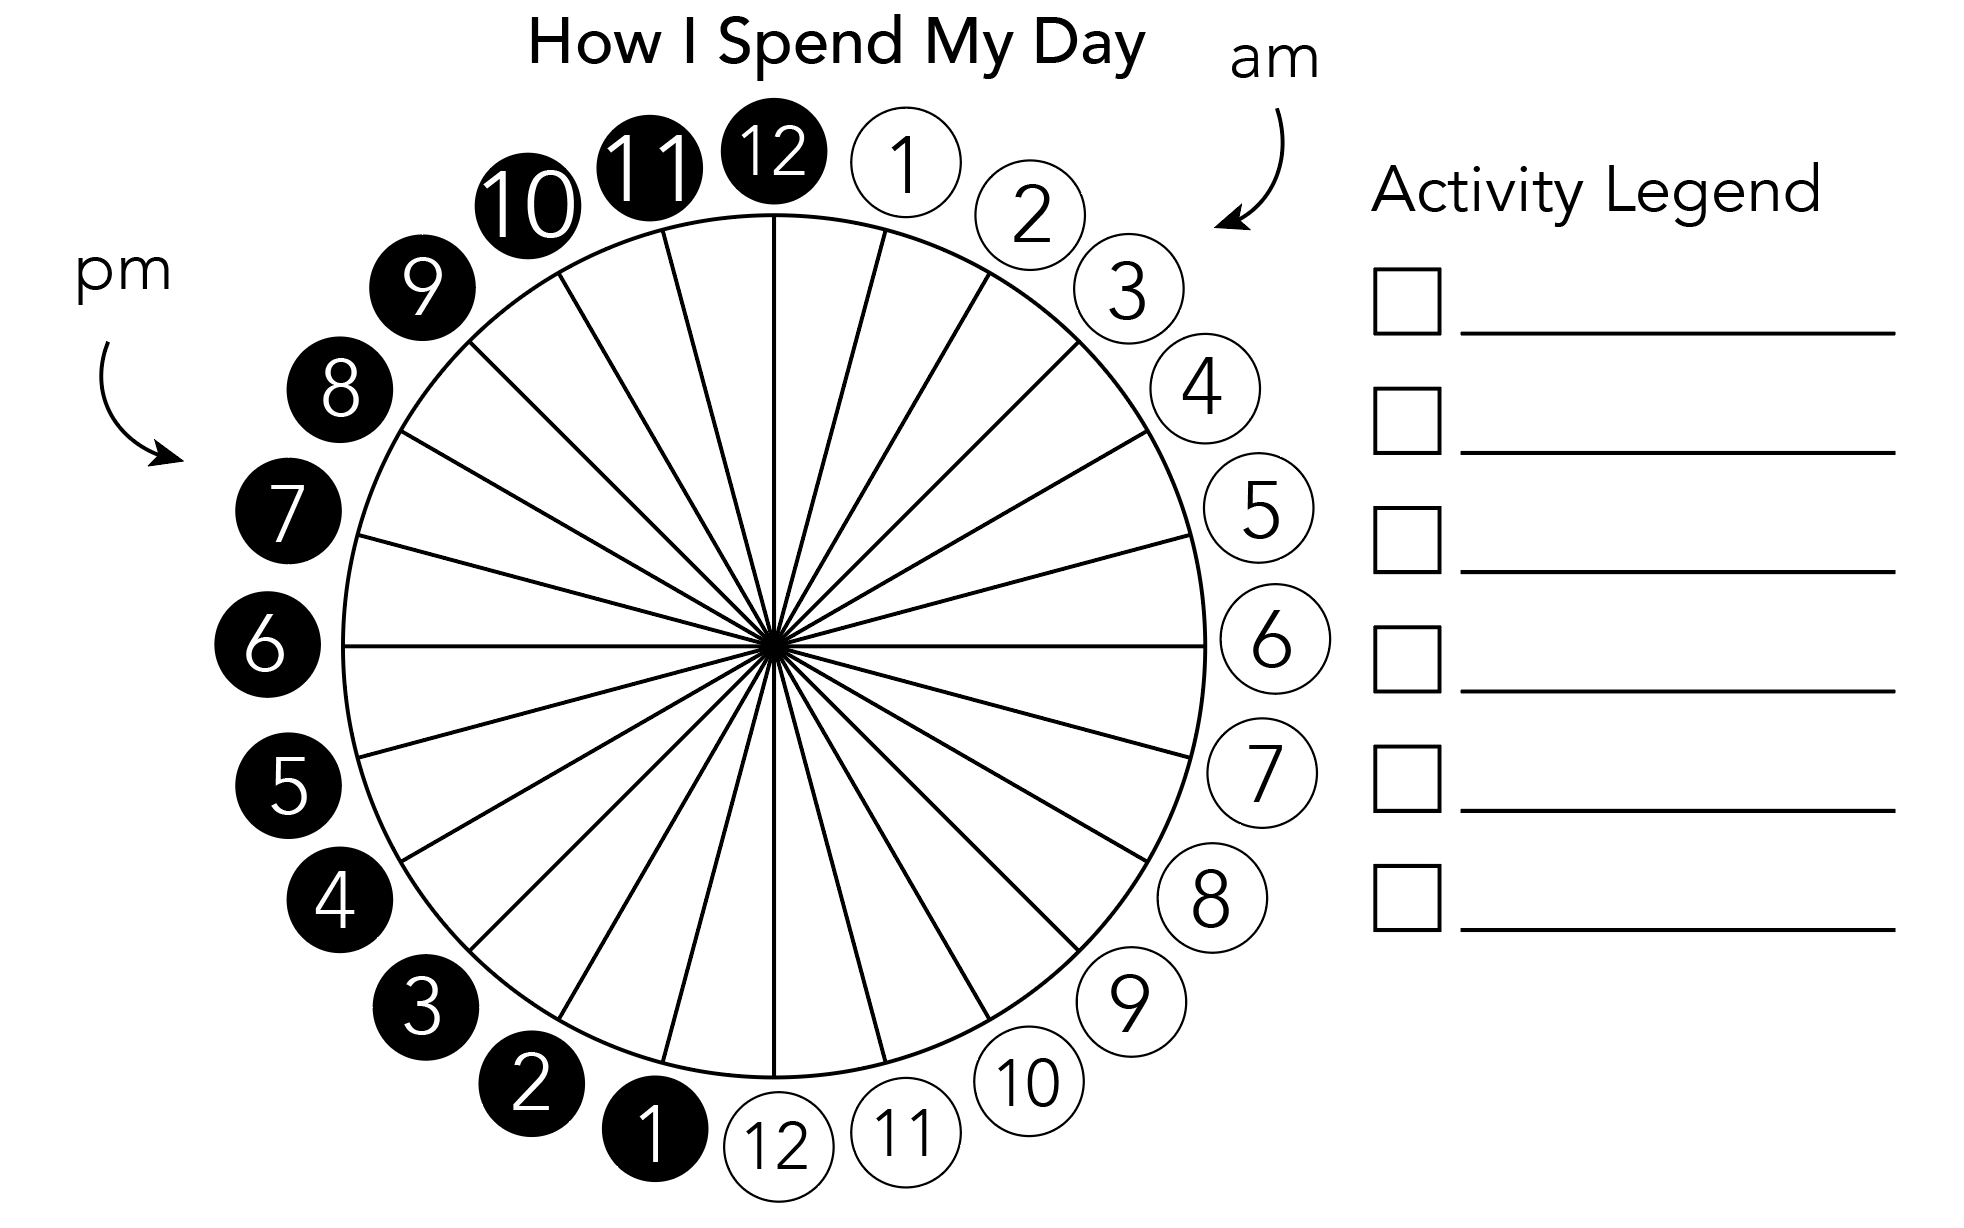
What does your daily schedule look like? Do you know how long you spend sleeping, or how long it takes you to do your homework?
A pie chart can help us see the different parts of a whole, and compare the sizes of each part. This pie chart shows us someone’s daily schedule, and how much of the day each activity takes. The purple portion shows when they are asleep—from around 9:30pm to around 6:30am. (Can you guess? I wonder if this is a school day or a weekend?) They also spend some time eating, doing chores, working, exercising, and having fun!

Now it’s your turn!
You can color in this empty chart to see what your daily schedule looks like. The legend will help you keep track of what each color means.
Did someone say snow day?
How often do you check the weather forecast to see how hot or cold it will be in upcoming days? Have you ever looked at the weather forecast for another city, too?
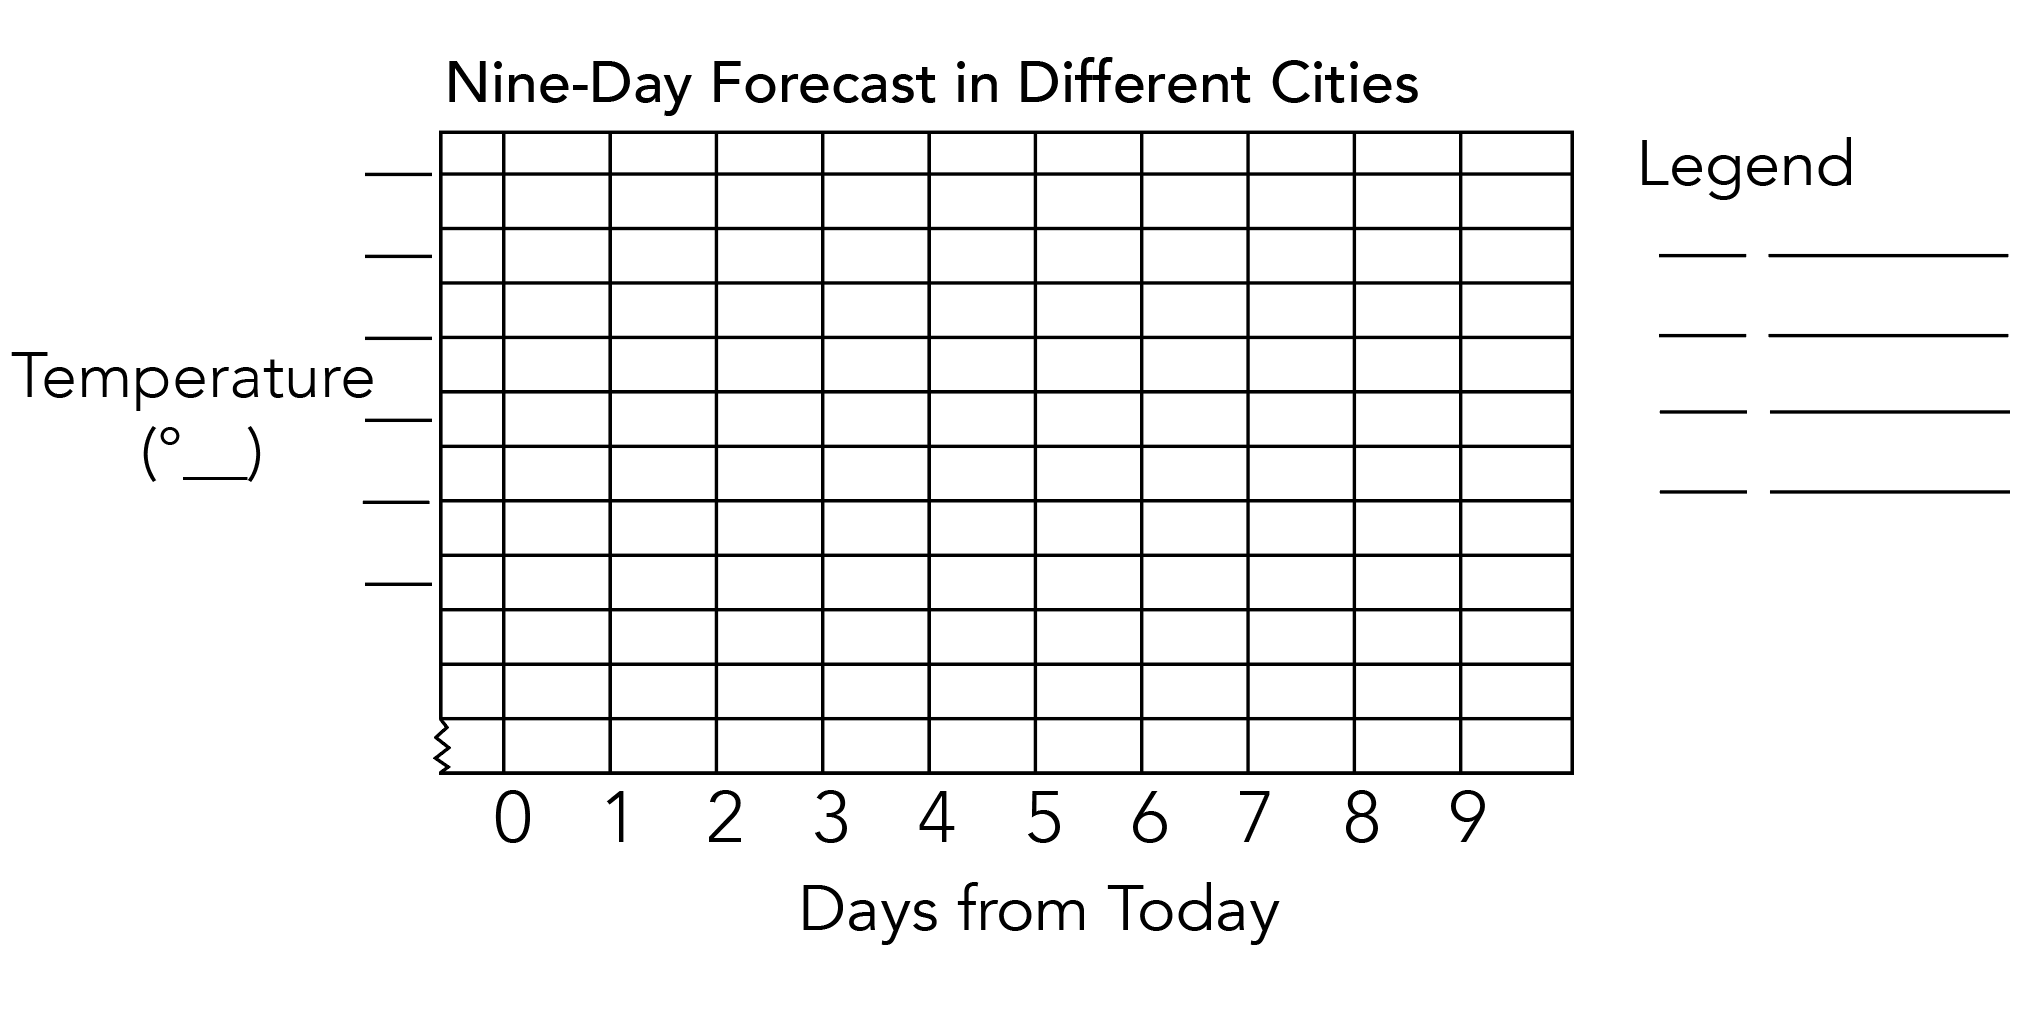
Line charts are perfect for graphing weather forecasts because they show change over time. For example, you could use a line chart to show if there was more rain in your region this summer than last summer. Line charts can also show how two or more things change over time by using several lines with different colors, patterns, or shapes.

This graph shows the forecasted temperatures for two cities: Seattle and Portland. Notice that the temperature scale starts at 74ºF—that’s okay, because the squiggly line below it tells us that the lower temperatures are not shown.
It’s your turn!
Fill in this blank graph with the weather forecast for any cities you choose! You can show the weather for your hometown, a city where you have relatives, or even a city you’d like to visit. The legend will help you keep track of what the colors and symbols mean and make it easier for others to understand.

Nancy is a data visualization professional with experience in design, development, research, speaking, writing, and teaching.
- Nancy Organ