
“Daddy, what’s your job?”
“Mom, what are those pretty pictures? I want to make some too!”
The idea
Anyone who loves their job has probably wanted to share it with their kids—get them excited about it, show how cool and meaningful it is. Even if they don’t follow in our footsteps, maybe they’ll at least respect and appreciate what their parents are passionate about.
Sometimes it’s just a dream, but we want to find a bright and engaging way to talk to our children about what we do for work.

That’s how it was for us—Alex and Natalia—working in the field of data visualization. We really wanted to share our world! Data visualization is amazing: it’s full of beauty and logic, sleek designs, a variety of charts, fascinating topics, and the chance to work with important data.
Moreover, working with data and visualization is not just interesting—it’s useful! Especially in our fast-changing world. We wanted to give children valuable skills early on so they’re ready to face the grown-up world.

We want to create shared, precious memories: to capture that magical moment when a child is still curious enough to wonder, “What does Mom or Dad do at work?”
So we thought: let’s tell and show them!
With these thoughts in mind, we started exploring the idea.
Natalia already had experience creating data viz characters and telling stories about them, but now she wanted to make stories not for adults; but for kids. Still all about data visualization. Alex already had experience writing books!
And we wanted to bring this story to life as a book!
We agreed to start the project and went off to brainstorm, sketch, and imagine!
Characters and first sketches
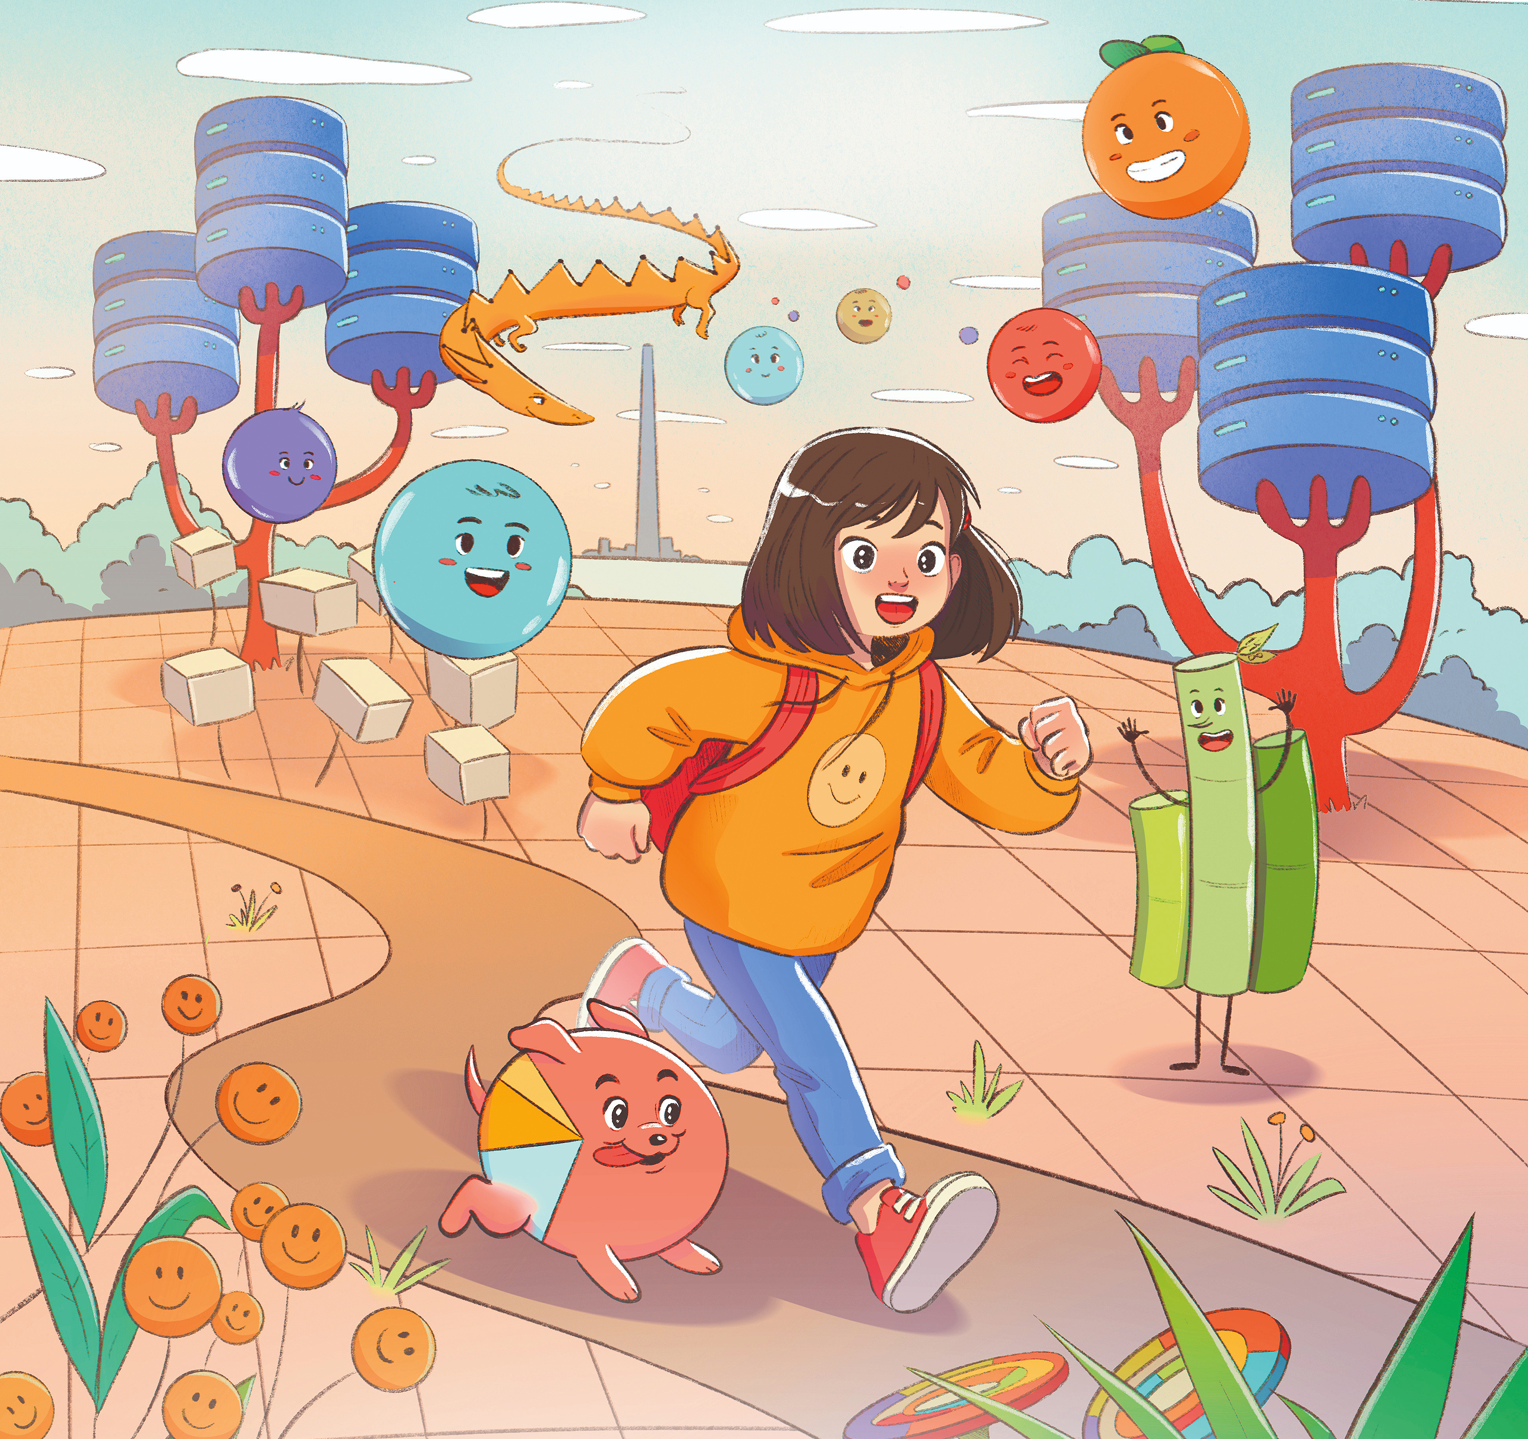
What’s a book without characters? Natalia decided it’d be better not to make them diagram-like people, but cute monsters or creatures. This way, they’d be easier for kids to tell apart—and we’d avoid having a big crowd of kids running around the book (great for comics, but not ideal for a storybook).
Naturally, the prototype for the girl character was Natalia’s own daughter, Maya—a curly-haired girl with red pigtails who loves bunnies. Over time, the character changed—her hair, color, and age evolved, which is completely normal.
We decided to name the girl Christine!

Then came the pie chart character. In the data viz community, the pie chart is often viewed with skepticism due to its limitations and how easily it can be misused. It’s unfortunate, because people do love the bright, round pie chart—it’s just part of reality. The trick is learning to use it well.
Our first diagram character was a pie chart, and we called him Piechi. Since pie charts need careful handling, Natalia imagined Piechi as a kind of dog that needs to be trained—not to overeat!

Everyone who learned about the book instantly loved Piechi. He became the mascot of the story and our favorite character—just like pie charts: lovable, though not always easy to manage.
Later, we started developing the Dad character, bits of the plot, and other chart-characters.
We tried several versions of the Dad—he’s a tired, somewhat sad data professional. But (spoiler!) this is so he can become joyful again by the end of the story.
At this early stage, the other chart characters were still not fully formed. But we did keep some early sketches of them too.

The plot
So, you have an idea who this book is about—but what actually happens in it?
We decided to go with a plot as old as time: a girl travels into a mysterious world of data to rescue her father, who’s gone missing within it!
Alex worked on the twists and turns of the plot, inventing obstacles and adventures, vividly describing the challenges on Christine’s path to save her dad. He also dreamed up the mysterious chart characters who not only help Christine on her journey but teach her how to use each chart properly!

Each chart has its own personality and unique “diet.” They’ll share those secrets in the book, too!
Christine bravely journeys toward her goal—a mysterious Data Tower always shimmering on the distant horizon—accompanied by her loyal chart friends, overcoming tricky challenges to discover what happened to her father and to rescue him!
Illustrations
Of course, making a book isn’t easy. We started with the plot and text. We outlined the key story points and structure. Afterwhich, Natalia did a storyboard while Alex finished writing all the text. That’s how we finally understood the storyline, the placement and meaning of illustrations, and completed the manuscript.
Then came the time to draw!
Natalia can draw, but mainly in small formats. She didn’t have experience with book illustration, and creating book artwork takes a lot of time—especially while working and raising a small child. It became clear we wouldn’t finish the illustrations in a year… or even two. So we decided to look for help and find ourselves a wonderful illustrator!

This too was a challenge—we needed a style both authors liked, someone with experience in children’s books, available time, and ideally some familiarity with data visualization.

All the illustrators were incredibly talented, though we couldn’t work with everyone. But it was amazing to see different takes on our characters—Piechi in particular got a lot of interpretations!

We tried out a few spreads with different illustrators before finally choosing Anastasiya Lykova as our lead illustrator. She has a young child herself, so the story resonated with her—and we loved her soft and expressive illustration style.
We didn’t want the book to be just a story—we wanted it to be useful too. So we included a chart chooser, and pages with profiles on each chart-character at the end of the book.
What’s next?
To start telling the world about the book, we put together a website introducing the story and its characters—the charts! Now this website has grown into a full-fledged data project for kids: Data2Kids! It includes a children’s competition, educational materials, merch, and of course, this book.
We even want to bring together a local community of data-parents and try out this format all together!
And we wanted to create more opportunities for shared activities between children and parents.
We decided to make a little workbook for kids: with fun, simple data visualization tasks, drawing prompts, unusual challenges, and ways to spend time together collecting data and making charts. The workbook is currently in development, and we’re testing the first version with our local community!

With the book finally published and a growing local community of parents and children learning data visualization alongside the book’s characters, we’re excited to launch an international children’s data-visualization competition—Data Kids!

Dates will be announced soon—meanwhile, you can already explore examples of children’s data-viz projects and educational practices from our local contest and subscribe to the project’s newsletter!
We’d be happy to see you there! And we really hope to run more data-visualization activities for kids this spring! We also decided to create a themed workbook where the book’s characters will help children practice creating and using charts.

If you’re interested in the Data2Kids project, and want to help introduce kids to the world of data and dataviz, check our book Christine and the Magic Charts!
Thanks for reading!
We hope that, like us, you want to pass on the magic of this unusual but fascinating profession to the next generation!

Alex Kolokolov
Alex Kolokolov has been working in the business intelligence industry for the last 15 years. His passion is dashboard design and development. He is the founder of Data2Speak Inc., an agency that provides BI services and trainings. Alex is also the author of three books: Dashboards for Executives (2019), Make your Data Speak (2023) and Data Visualization with Microsoft Power BI (2024). He organized the international dataviz conference and the “Make Your Data Speak“ award.

Natalia Kiseleva is an engineer and BI analyst, dataviz & BI trainer at the HSE, Moscow State University, MGPU, EU, IBI.
DataViz and Data Art popularizer, the comic artist and data artist.
-
Natalia Kiseleva

-
Natalia Kiseleva

-
Natalia Kiseleva


