
बस हवा से भरे गुब्बारे हैं ये
सुई चुभा दो तो फट जायेंगे।
लोग गुस्से में Bomb नहीं बना करते !
~Gulzar
Rough translation of the above lines goes something like this:
“These are just balloons
filled with air.
If you prick them with a needle,
they will burst.
People don’t become bombs when they are angry!

Have you ever been intimidated by people who are experiencing intense anger or sadness?
While I am still researching the mood swings of adults, I can say for sure that it doesn’t take long to cheer up the kids. A simple tickle or a playful game can instantly brighten up their day.
The other day, Pariza was sitting at the kitchen table, her eyebrows furrowed in disappointment as she stared at the Scrabble board in front of her.
Her best friend Zoeya had just left after a fun evening of playing board games, but Pariza was feeling down because she had lost the latest game of Scrabble.
“What’s the matter, Parizu?” I asked, noticing her sad expression.
“Didn’t you have a good time with Zoeya?”
“Yes, we had a great time, but I lost the game and it’s so frustrating,” she said, sighing heavily.
First I teased her, but looking at the seriousness of the situation, I tried to comfort her. “It’s okay to lose sometimes, Parizu. That’s just part of the game. You can always try again and see if you could do better next time.”
She nodded but was still unconvinced, so I offered her my data skills to analyze the game so she could improve the next time =)
She quickly ran to bring the score:

“Wow! This looks like a close game,” I said looking at the score
“Yes! That’s why it is more disappointing.”
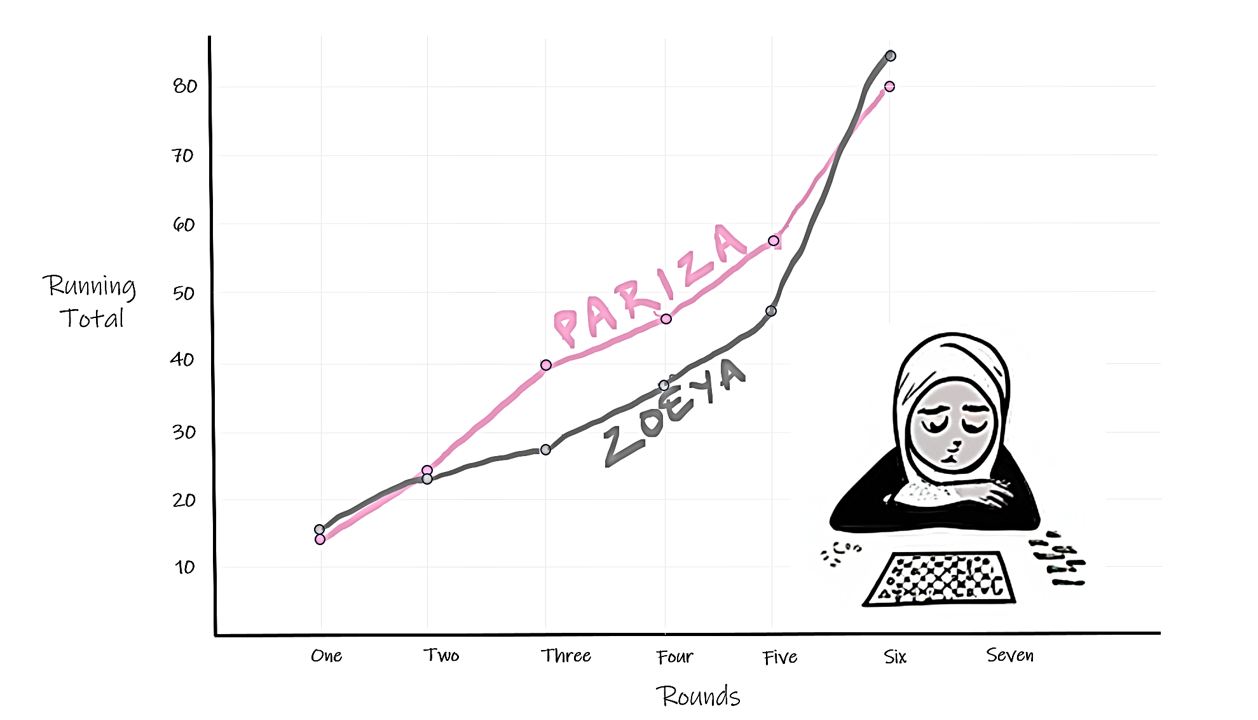
I wanted to see the trend as opposed to how much they scored in each round, so we went and calculated the running total of their scores.

We first plotted the different points for Pariza’s score:

“Abbu,” Pariza said, “this starts to look like the growth chart the doctor shows me in every visit.”
Ha ha! This indeed reminds me of the growth chart =)
She then connected the dots:

Then we did a similar exercise for Zoeya’s score:

And just like for Pariza, we connected these dots:

“Oh my God! I was leading all the way, Abbu,” Pariza exclaimed with surprise, standing there with her mouth wide open.
“Yes! You were a clear winner but just got beaten with a very small margin in the end.”
“Zoeyu got the letter Q in the last round. She used it to make the word EQUIP with it and got 3 times points as she touched triple point tile.”
“So, Parizu, you now know that you need to target those in the next game.” I tried to pitch in my recommendation just as I do to the business stakeholders 😉
Your turn to play
Next time you play Scrabble or your favorite board game, don’t throw away the scores. Just like shown in this article, you could use it to analyze the scores and create a wonderful data visualization. For more engaging ways to boost your kids’ data literacy, be sure to check out Drawing Data with Kids. It’s packed with creative ideas to help them explore the world of data!


Hi there, I'm Gulrez Khan—father of 3 beautiful kids and award-winning author of Drawing Data with Kids. By day, I work as a Data Science leader, and by night, I read bedtime stories to my kids. Sometimes, the roles overlap—I'll find myself storytelling in conference rooms or teaching data concepts to my kids. It’s funny, but it works!
If you're interested in a workshop for your team or school, feel free to message me.
- Gulrez Khan

- Gulrez Khan

- Gulrez Khan

- Gulrez Khan


