
A Mother’s Unwavering Journey: Navigating Pregnancy, Full-time Job, and Motherhood. Through sleepless nights and overwhelming fatigue, I found solace in data tracking, discovering my strength and the beauty of resilience.
Being a mother to an energetic toddler boy is a relentless rollercoaster. Each day demands boundless energy, endless patience, and love. Being a full-time working mum on top of that feels like an obstacle course, and when adding the first trimester of pregnancy into the mix, it’s like battling the devil.
The first trimester of my first pregnancy was a walk in the park. That led me to believe that the first trimester of my second pregnancy would be the same. But that could not have been further from the truth. I experienced every symptom on the pregnancy list: waves of nausea, sleepless nights, countless trips to the bathroom, loss of appetite, and a relentless battle with fatigue that threatened to consume me.
Going to bed at night became a dreaded ordeal. The once comforting haven of my pillow, where I would rest my weary head after a long day, now held a haunting sense of fear. My husband did his best to support me, taking care of our son Ethan alone during the evening routine and ensuring I had all the pillows and comfort I needed, but still, peace was out of reach. As sleep eluded my body, I started losing touch with myself.

Pulling on the anchor I gained while pursuing my Master’s Degree in Research, I found solace in collecting data on my sleepless nights and tracking my experiences. It helped me regain a semblance of control, serving as my guiding light in the darkest moments. Putting my experiences into an Excel sheet gave them a tangible form, something I could grasp and comprehend. I started noticing patterns, seeing an end to it all.
Tracking became a ritual, documenting the time and reasons for waking up in the middle of the night and logging them into the computer each morning. It became a way to acknowledge my pregnancy and offered me a sense of control. Once I completed the first week of data collection (the nine weeks of my pregnancy by that point), the data became a testament to my resilience, a reminder of my strength, and it empowered me to keep going.

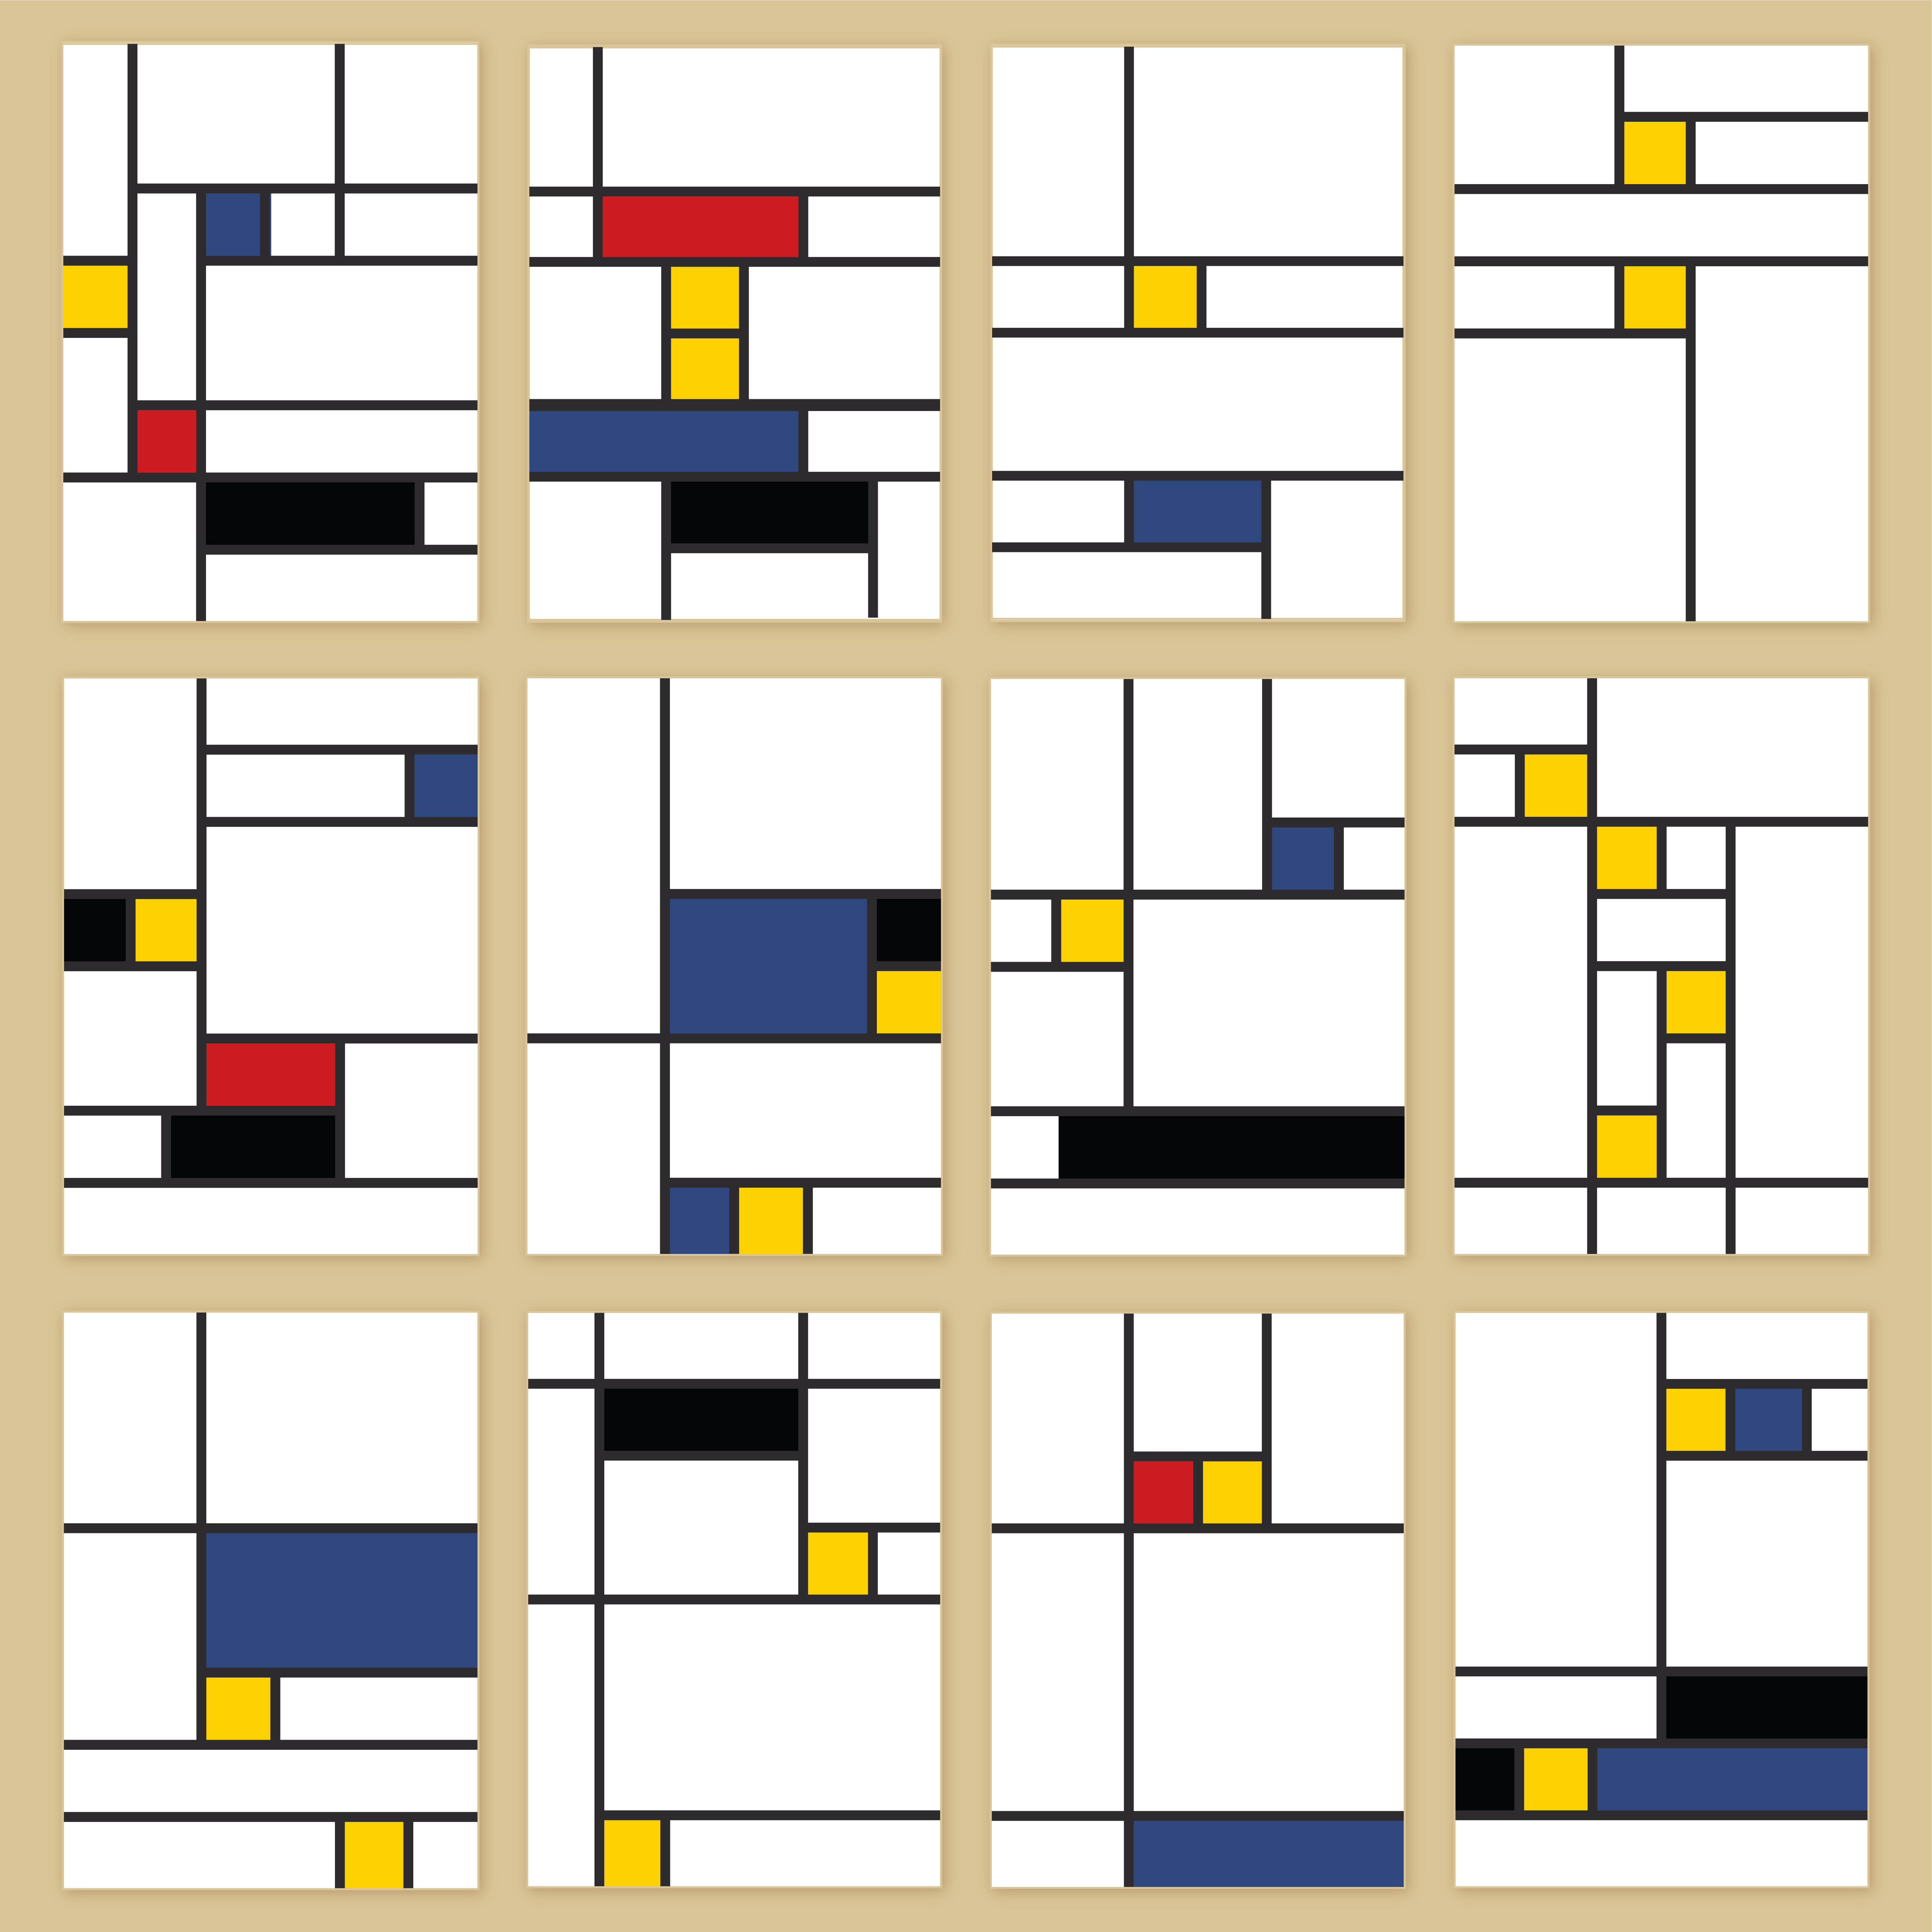
To make sense of it all, I used a Piet Mondrian-inspired design to represent my data visually. Mondrian believed that abstract art could distil the essence of realistic data and scenes into something universal and timeless. Tapping into his mastery of the abstract, I transformed my journey into a tangible display of endurance through squares of colour.
When I finished designing my first two weeks of data, I sat in awe before the Mondrian-inspired creation. My eyes traced the lines and colours that told the story and encapsulated my data. It embodied the purpose of my data collection, and I felt grateful for the strength that carried me through but even more amazed by the beauty that emerged from it.

It served as a reminder that even during endless, unwavering nights, beauty could always be found. More importantly, once again, my connection to the world of data visualisation has helped me navigate motherhood and triumph in the process.

Or is a critical thinker and an enthusiastic data-visualisation designer who finds patterns in everyday life and transforms them into clear, meaningful visual stories. She previously lead the UX & Data Visualisation within the Business Intelligence department at IEC. She just started a practice-based PhD exploring how data visualisation can support more balanced decision-making for people living with diabetes.
- Or Misgav

- Or Misgav

- Or Misgav

- Or Misgav


