
If you’re like us, at some point in your early education you decided you couldn’t draw. Your doodles, like ours, didn’t look like you wanted them to. For many, this disappointment can persist into adult life. As researchers into how people learn data visualization, we’re here to tell you that it’s OK — stick figures are fine! You can learn to sketch your data stories; in fact, you’ll see that research tells us that sketching is critical for working in teams and for breaking through “visualizers’ block.”
Learning to go from data to story is hard. You often have to wear many hats — statistician, analyst, domain expert, graphic designer, and more. One practice used consistently by data visualization experts is “sketching.” Most folks who practice data visualization have notebooks full of ideas for symbols, encodings, and narrative flows. Previous discussion in the DVS Slack channel has addressed this. But what makes sketching such an effective method? What can people getting started with data visualization learn from this practice?

Sketching helps us integrate different kinds of knowledge
Why do professional dataviz experts sketch? This is an important question to ask if you want to help learners develop this practice. Luckily, academics have been digging into this for a while — we’ve tried to translate some of what they’ve found into understandable motivations.
For one, the creation of external representations aids the learning process in many different ways. There have been studies on the role of externalization in learning, and others on the application of drawing to reason and learn within science education. These studies find that:
- drawing an idea makes explicit the metaphors and shorthands you’re using to think about the idea;
- a shared representation leads to more productive conversation and ideation in group contexts;
- physical representations allow you to see characteristics and relationships of concepts more easily.
We sketch for lots of reasons, but these studies highlight some of the key motivations that might inform your own approach to sketching for data visualization. Think about why you want to sketch: what do you hope to learn from the process that you didn’t already know?

The idea of integrating visual, verbal, and mental modes is further explored in Joanna Kedra’s thoughts on visual literacy. Kedra argues for the importance of visual literacy skills in an increasingly “multimodal” environment, and lays out visual literacy skills as being on par with reading literacy and numeracy. We evaluate and interpret images, “translating” between visual and verbal modes of communication, so sketching helps us try out images that communicate our ideas. Makes sense! Of course data literacy and visual literacy are not synonymous — data does not necessarily take a visual form — but, when we’re learning to sketch data visualizations, they are definitely interrelated.

These academic research projects establish why sketching is so important. Our brains are constantly translating the visual and the verbal, so externalizing this process helps us communicate and process more effectively.
Sketching to overcome “visualizers’ block”
People new to visualization often fall back on using data representations they are familiar with — bar charts, pie charts, etc .— without considering alternatives that could more effectively, or more appropriately, show the data. When you’re sketching you’re exploring a broader design space of your data visualization, having a visual conversion with yourself (and others) about how to represent the data effectively for your context and goals. Grammel’s work on how novices create visualizations shows us how this default to known charts particularly happens when learners have difficulty figuring out how to answer questions they have about statistical relationships with which they are unfamiliar. Similarly, Walny’s work on how learners sketch shows us that learners default to numerical representations over more abstract or symbolic ones.

Our takeaway? Drawing can be daunting, but sketches are useful even when the output doesn’t look “professional.” We learn more when we experiment and try new things, and you can surprise yourself with what you see when you try to put your thoughts and ideas down on paper. If you’re stuck on something, even if you feel unimpressed by your drawing skills, try sketching your way out!

When trying to design a data visualization, you can get stuck in lots of ways. Bressa’s work with data visualization novices, workers at a food bank, reveals some more insights from which to learn. This group struggled to move from text to visual descriptions. They also had difficulty managing the spatial aspects of their visualizations. Sketching helps with both of these challenges! Targeted approaches to visual brainstorming can address these barriers more directly, for instance if you get stuck on how to visually represent a concept or word you can try an exercise like creating a visual “word web.”
Building and bolstering data literacy
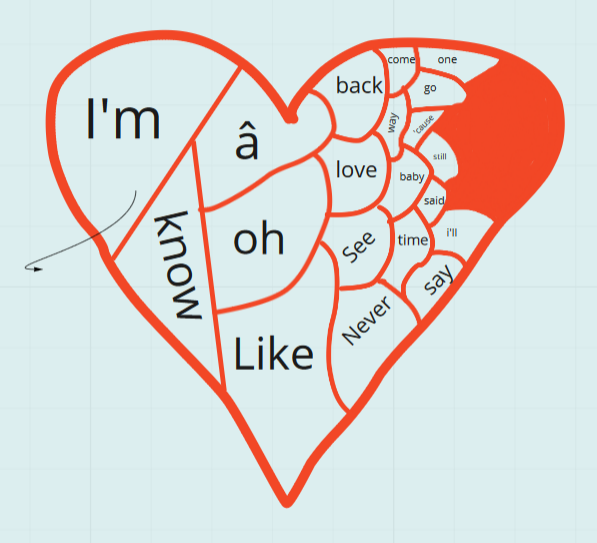
Why do we care? Our Data Culture Project is a free, lightweight, self-service curriculum of playful activities designed to help people build “data cultures” in their organizations. One activity in this toolkit, Sketch a Story, focuses on helping all kinds of people learn how to sketch — challenging them to quickly draw visual “data stories” based on word frequency data in political speeches and song lyrics. This is an exercise in creating a narrative from data: whatever factoids or relationships stick out to them in the frequency data are transformed into a visual representation, with participants working together in small groups with big paper, markers, and crayons (or when circumstances require, using online tools like Miro).


We’ve run this activity dozens of times, leaving us with a corpus of hundreds of sketches created by diverse groups of data literacy learners — higher-ed students, staff at non-profits big and small, government employees, journalists in newsrooms, and more. Feedback from this activity suggest it has a positive impact: more than half of participants in a testing workshop said it made them feel more comfortable with analyzing text, and a majority also found it both useful and easy.

A preliminary review of these sketches has shown some interesting patterns. For example, color (as opposed to other variables like size, shape, font, or position) seems to be the most common method used to differentiate different elements and categories in a sketch. And the majority of stories being told are comparisons: showing the difference between two parts of the dataset, or identifying an outlier within an overall trend. As we move forward with our exploration, we hope to discover more patterns, and add to what we know about the process of learning to sketch and work with data to tell stories.
Remember: stick figures are OK! The point of sketching isn’t to produce a beautiful work of art, but to get your thoughts and ideas into a format that leads you to new insights and ways of thinking. Importantly, sketching allows you to flex your creative muscles without any constraint: with your paper and pencil, you can do whatever you want. While more constrained tools like software and programs for creating data visualization undoubtedly have their place in the process, they don’t allow for the kind of unfettered exploration you get from just sitting down and sketching. Hopefully, this post helps you understand a little more about what research has to say on how and why we sketch to help us visualize. We look forward to learning even more in the course of our own research, and sharing these findings about the nature of sketching to help you with your own learning process.
This work was also accepted to the 2021 IEEE Visualization Conference.
Dee Williams is a puzzle enthusiast, inveterate bookworm, and graduate student in Experience Design at Northeastern University. She currently works on research for data literacy and health equity.
Rahul Bhargava is an educator, researcher, designer, and facilitator who works on data storytelling and technology design in support of social justice and community empowerment.
-
Rahul Bhargava


