
September 2022 has been one of the hottest Septembers in the last 143-years of global climate record, as per the National Oceanic and Atmospheric Administration (NOAA).
Rising land surface temperature (LST) can create urban heat island (UHI) effects especially in metropolitan areas. In most metropolitan cities, based on the type of building materials used and the proximity of the buildings, the chances of heat being absorbed is more likely, leading to formation of urban heat islands, thereby increasing energy consumption (e.g., use of air conditions). At night, the heat absorbed by the ground and surroundings is released back into the environment, perpetuating the urban heat island effect.
UHI is known to have a significant impact on human health, causing heat-strokes, heat exhaustion, respiratory difficulties, and other ailments especially impacting low income communities. Some statistical approaches have estimated close to 1,300 deaths annually in America due to extreme heat. The Heat Island Research Group has approximated that a city like Los Angeles, California, spends $100 million per year on energy alone. Hence mapping of UHI is one of the key areas of interest for many municipality and city planners, UHI mapping has also become a part of the Biden administration’s Justice 40 Initiatives.
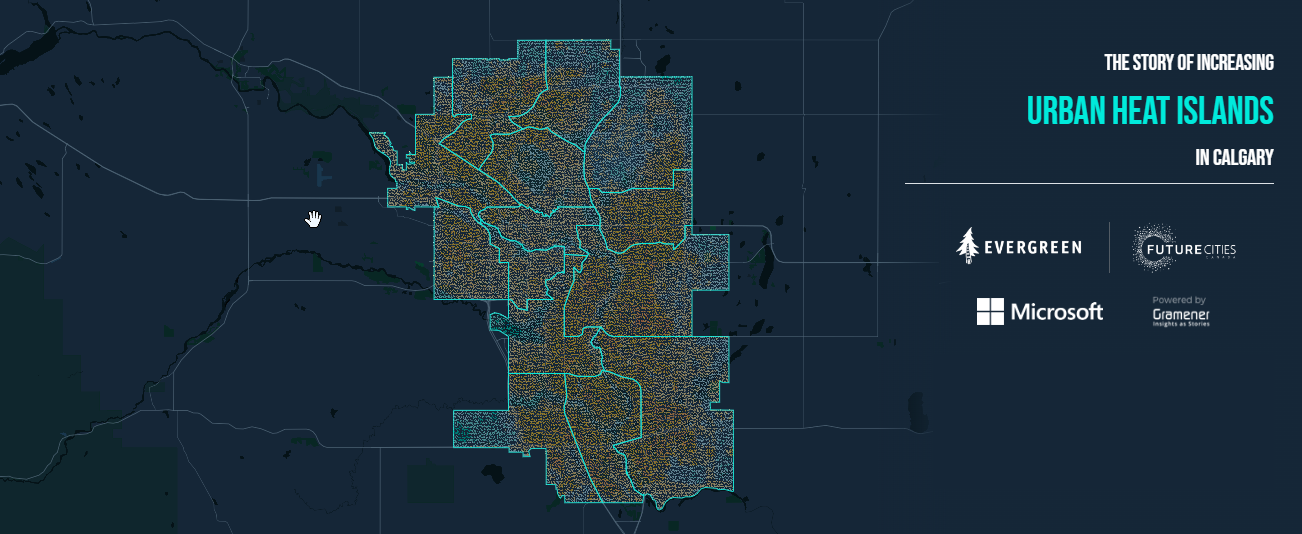
At Gramener, along with my colleagues Nikhil Kabbin and Sumedh Ghatage, we created an AI tool that maps the land surface temperature of an entire city to 48m X 48m pixel size using Landsat 8 satellite images, following the standard procedures in the official Landsat-8 handbook.
The temperature of these 48m X 48m parcels of land can range from 5 to 52 °C and are differentiated by colour. Along with the LST, we have mapped vegetation index, built-up index, building details, and population approximation on each and every individual 48m X 48m land parcels.
For example, we looked at the LST for Calgary, Canada, and found a few interesting locations. One such location is CF Market Mall (denoted by the red box), where you can see a sudden spike in LST. Interestingly, the areas surrounding the red box have a lower LST.

Using Landsat satellite images, we observed a similar trend from 2013 to 2020 for the same spot. The difference in LST for this red-boxed spot versus surrounding areas can be higher than 3-4 degrees during very hot summer months.

A closer look via high-resolution Google Earth images of the exact spot reveals the following details:
a. There are multiple air conditioner units on top of the mall
b. The mall is surrounded by a big, open parking lot
c. There is much less vegetation coverage within the mall premises

Vegetation index is one of the biggest indicators for LST and we observed that the vegetation index has not changed much from 2013 to 2020 for CF Market Mall location.
- A side-by-side comparison of the spot from 2013 to 2020 confirms the absence of vegetation
- Whereas the immediate neighbouring areas have high vegetation index

Similarly, our tool can help municipalities locate hotspots resulting from man-made built up, which has consistently shown high LST dating back to 2013.
- Multiple commercial shops (e.g., Calgary Co-operative Association Limited, etc.)
- Dalhouise Station Shopping Centre
- Walmart, Best Buy, and other commercial shops
- Bowness High School
- CF Market Mall (shown in the above images)

Land surface temperature has continuously increased based on measurements made from 1880 to 2018 with the warming rates rapidly increasing in the last few decades 0.19 to 0.2°C per decade between 2000 to 2018. Based on these trends, land surface temperature and the urban heat island effect will be considered among the key and immediate climate risks for most cities.
Our tools enable the municipalities to measure changes in LST, vegetation index, and other variables at a very granular level, and make better decisions on future development projects for their cities. To access the case study and the anonymized version of the tool, click on the following link.
Although different municipalities may formulate different strategies to mitigate city hotspots, there are certain well-known practices that can help in reducing LST, which include: installing green roofs, which can drastically help reduce urban heat island effect; painting roofs white to help reflect incident sunlight, hence provide a cooling effect; using high-albedo roof coating and infrastructure materials; and utilizing green infrastructure.

Mrinal Ghosh is an Associate Principal Consultant at Gramener. His passion is in using data to bring out compelling data stories and helping businesses to transform data to information and information to actionable insights. In his free time, he likes reading about science and astronomy and listening to electronic music.
- Mrinal Ghosh


