
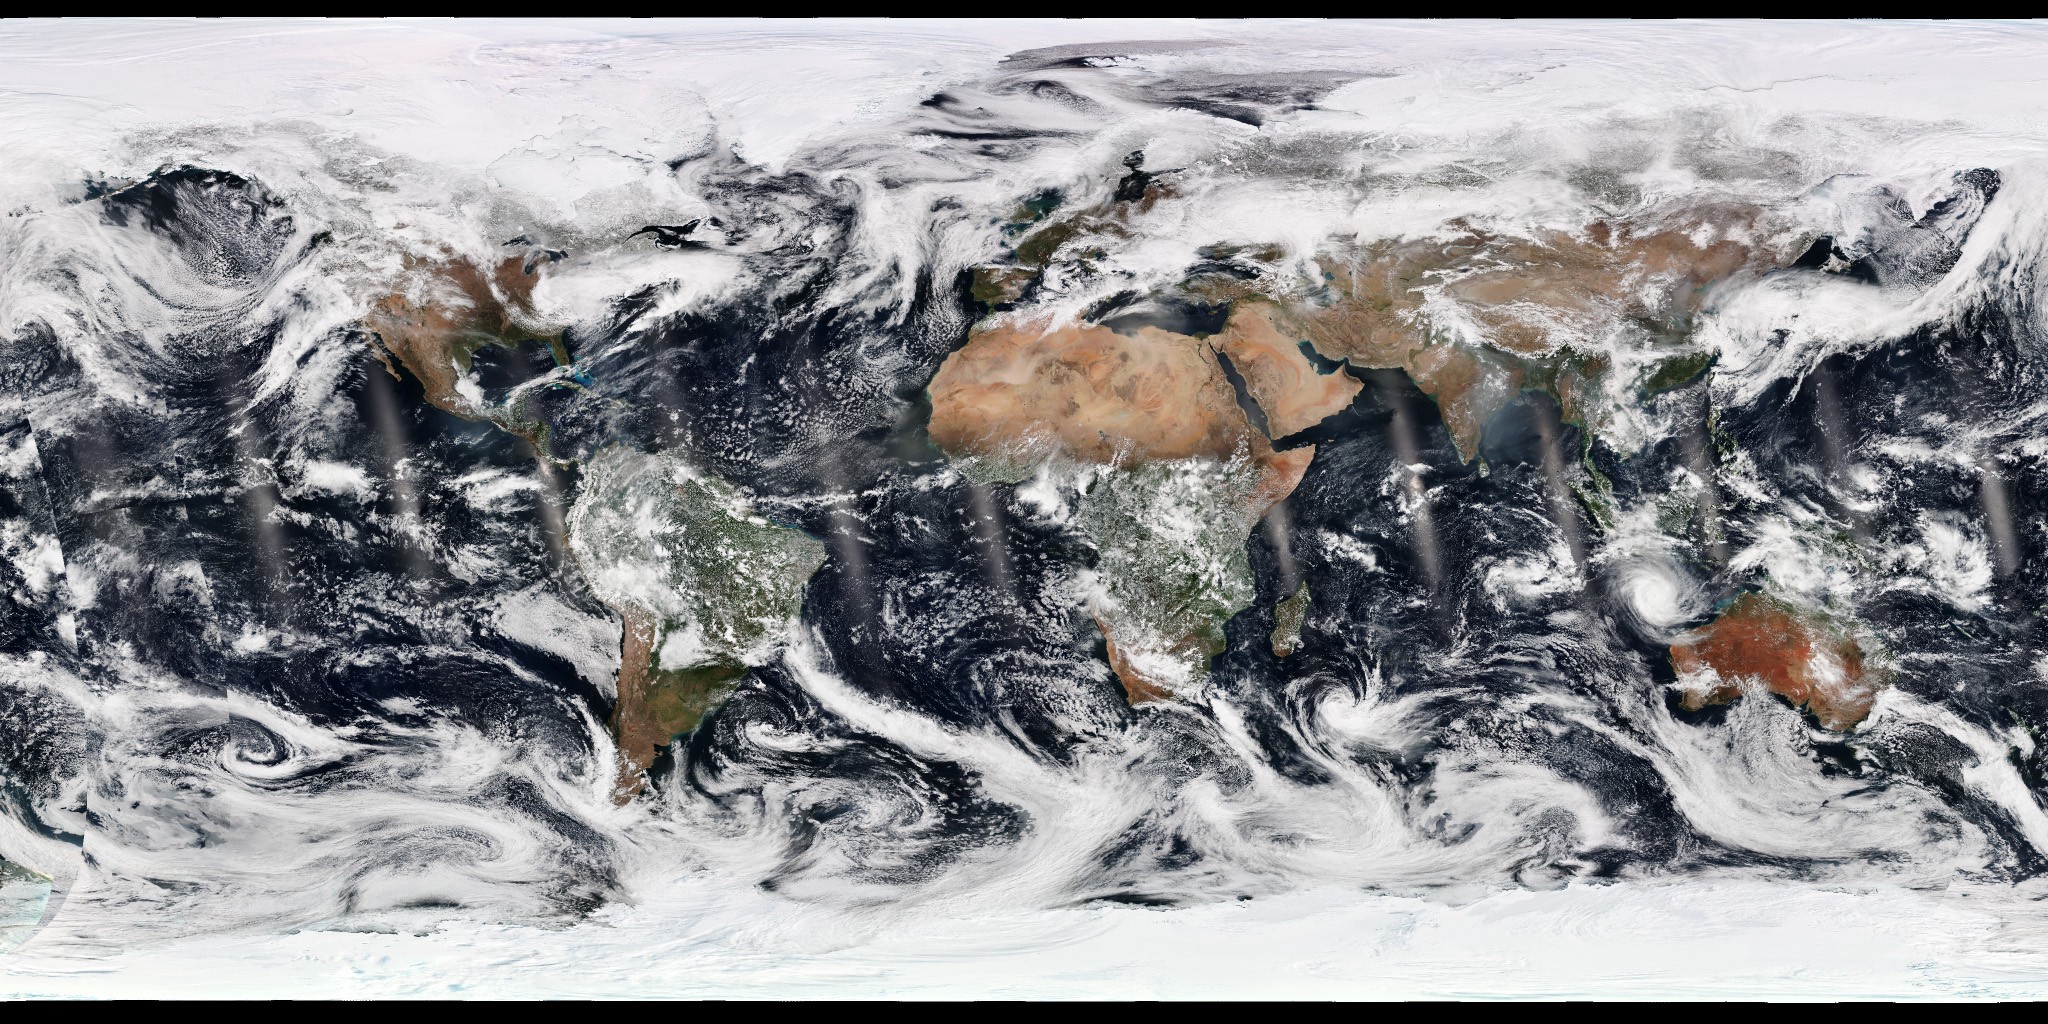
We are living in a golden age of access to information about our home planet. Just twenty years ago, access to satellite data was limited to the world’s biggest militaries, wealthiest corporations, and a handful of government scientists with access to scientific workstations, boutique software, and (most importantly) postdocs. Now, petabytes of data are available to just about anyone—we can see the whole Earth every day, in unprecedented detail, such as in the image above. This is what the Earth looked like on March 21, 2018. One instrument — VIIRS — collected this data over 24 hours while circling the globe 16 times, crossing the equator from south to north at 13:30 local time on each orbit.
Or drill down to Los Angeles International Airport and count planes on the tarmac:

There’s more and better satellite data around than ever before. In fact, there are so many sources of satellite data that it can be confusing and frustrating to navigate through them. So many that geographer Harel Dan even created a spreadsheet to keep track. On top of that, data access and data processing can remain opaque, time-consuming, and expensive.
I’m here to (hopefully) help, with a few links to sample datasets, examples of opening and manipulating imagery in QGIS, then exporting the data to GIMP for further processing. For some background info, I’ve previously written about how to use the USGS’s Earth Explorer to find & download Landsat data, Photoshop-based tutorials on how to make a true-color Landsat image and how to process PlanetScope imagery, and a Gentle Introduction to GDAL — an immensely powerful but baroque command-line tool for manipulating geographic data.
Part 1: Accessing Sentinel-2 Data on Sentinel Hub
Combined, the Sentinel-2 satellite pair provides coverage of the Earth every 5 days in 12 different bands (think colors, but including colors we can’t see—read Why is that Forest Red and that Cloud Blue for more info) at resolutions up to 10 meters per pixel (about the size of a house). The data is perfect for covering anything from the size of a city to the size of a smallish country.
There are probably over a dozen ways to access Sentinel-2 data, but Sentinel Hub EO Browser is fairly straightforward, fast, and sponsored in part by the European Space Agency, so they’ll hopefully be around for a while. You have to register, but it’s quick and they haven’t bothered me yet.
Once you’re registered and logged in (that wasn’t so bad, was it?) you should see something like this:

A map interface centered near Rome, Italy. Pretty enough, but let’s find an even more dramatic landscape. With mountains and glaciers and alpine lakes. Go to the search box in the upper right, and type in Chamonix, France—it will try to auto-complete for you but it’s localized so your mileage may vary. Hit return and the map will re-center on Chamonix Mont-Blanc.

Now focus on the options palette open in the upper-left corner of the window. Here you can choose which datasets to search, acceptable cloud coverage, and an applicable time range. Leave Sentinel-2 L1C checked, and hit the big green search button.

The results will appear in the same palette, which has grown to accommodate a handful of thumbnails. On the map itself, the footprint of each tile (Sentinel data is broken up into tiles to keep the data size manageable) appears as a translucent blue overlay.
When I did this (mid-April 2018) the tiles were all very…white. Which implies a lot of snow, or clouds, or both—which isn’t all that surprising during spring in the Alps. You could start scrolling through the data to find a good image, but it might take a while—it was a long winter.
Instead, let’s try limiting the maximum acceptable cloud cover and restricting our date ranges to the summer when there will be more variety in the landscape.
Click the Search tab (just to the left of Results) then set Cloud coverage to 10% and narrow the date range from 2017–06–01 to 2017–09–30. Mash that big green Search button one more time, then scroll down until you get to the thumbnail from 2017–07–04 and a time of 10:36:37 AM. If you mouse over the thumbnail you’ll see one of the blue footprints turn green, indicating where in the world that particular chunk of data is located. The town of Chamonix is just on the northern edge of the tile.

To get a closer look at the data, click visualize on the tile, which will render it at full resolution on the map, like so:

At this point, you could Download image and call it a day—there’s even a choice of a few false-color band combinations and calculated products—but where’s the fun in that? You’ll want the raw data to make the most visually appealing imagery. Go back to the Results page, and click the tiny green link icon, to the right of Visualize. That reveals two options: AWS path and SciHub link. I prefer AWS path, since it allows you to download each band separately—most people don’t need all 12 bands. So click that, which leads to a page on Amazon Web Services where you can download each band as a separate JPEG2000 file.

For true-color (red, green, and blue) right-click and download B02.jp2, B03.jp2, and B04.jp2. You should be able to open these in image editing software like Photoshop, GIMP, or even Apple’s Preview—but they’re data, not just imagery, so you might not be able to make sense of them. Which is the topic of part 2: Pre-processing Data with QGIS.
More chapters coming in the next weeks! (Or see them all on Medium)

Robert Simmon is a pioneering designer and visualizer renowned for his work in cartography and science communication. With decades of experience at Planet and the NASA Earth Observatory, he transforms satellite data into captivating imagery. Robert's work has appeared on the front page of the New York Times, the cover of National Geographic, and he crafted the iconic Blue Marble featured on the original Apple iPhone. His expertise in data visualization, remote sensing, and the use of color has left a lasting impact on the field. He is currently freelancing and open to full-time opportunities.
- Robert Simmon

- Robert Simmon

- Robert Simmon

- Robert Simmon


