
I’ve always been interested in the aesthetic side of dashboards beyond what the tools offer—importing custom backgrounds and graphic elements created outside of BI software.
The internet “reads” your interests, and gradually your network expands. At some point, I became part of the Flowers and Figures community, joining others who are interested in data art and passionate about creative projects.
My path
At first, I was just studying the works of others, hesitating to try it myself, though ideas for data encoding had been circling in my head. As is often the case, my first attempt happened by accident. A few members met offline at a café just before Christmas to get to know each other and to attempt creating a data art project right there, on paper, using pens or markers, based on each person’s own data.
I loved it! Both the process and the result, even if it looked quite simple.

After that, I was eager to create something of my own—something real, not on paper.
As with any data visualization project, the key steps are:
- choose a topic
- find data
- and, in this case, invent a way to encode the data into visuals—the most creative part, in my view
An important decision is the path you take in encoding and presenting data art:
- One way is symbolic—any geometric figure, flower, or petal can mean anything, depending on what data value or category you assign to it
- The other way is to keep it as close as possible to the real object in the data, which isn’t always feasible.

The first step for every new community member is entering their data into a shared Google Sheet. This forms a dataset that can be used to create a full-fledged piece of data art. A community portrait—sometimes called data badges—is a popular format in data viz spaces, especially within communities or at conferences and events.
The range of themes for data encoding in the community is wide: geometric shapes, flowers (matching the community’s name), even bugs, and coats of arms. I wanted to create a community portrait that stood out from the gallery. And this time, I really wanted the project to exist physically; to photograph it and then compile a digital version.
According to the format rules, the portrait had to show:
- skills—drawing, crafting, data, data viz
- proficiency level in each skill
- name, gender (optional)
Dataset: Google Sheet where each new participant fills in a row about themselves.
The idea of physical data art
For representing the skills, I chose colorful plastic cable ties—commonly used to bundle wires and cables. They’re a simple and effective way to connect elements, widely used in construction and daily life. My daughter, a student, used longer ones to secure her rolled-up architectural drawings. These ties can withstand quite a bit of stress.
I wasn’t interested in technical specs though—the important factors were color and minimal size. There wasn’t much variety in colors—most sets offered standard combinations: red, blue, green, yellow, and orange. So I worked with what I had.

The encoding took shape
- Colorful ties = skills: drawing, crafting, data, data viz
- Proficiency level = length of the tie: trimmed literally to 1, 2, 3 cm or fully cut off if the level is 0

The hardest part was figuring out what to attach the ties to. I tried wooden coffee stirrers—too long. Chopsticks—needed cutting or grouping data for 2–3 people, which felt clunky and undermined the clarity of the concept.

I browsed various craft supplies, school kits, and eventually found counting rods—those plastic sticks used in early math learning kits for first-graders. Perfect for the project: 6 mm in diameter, 6 cm long—exactly what I needed.
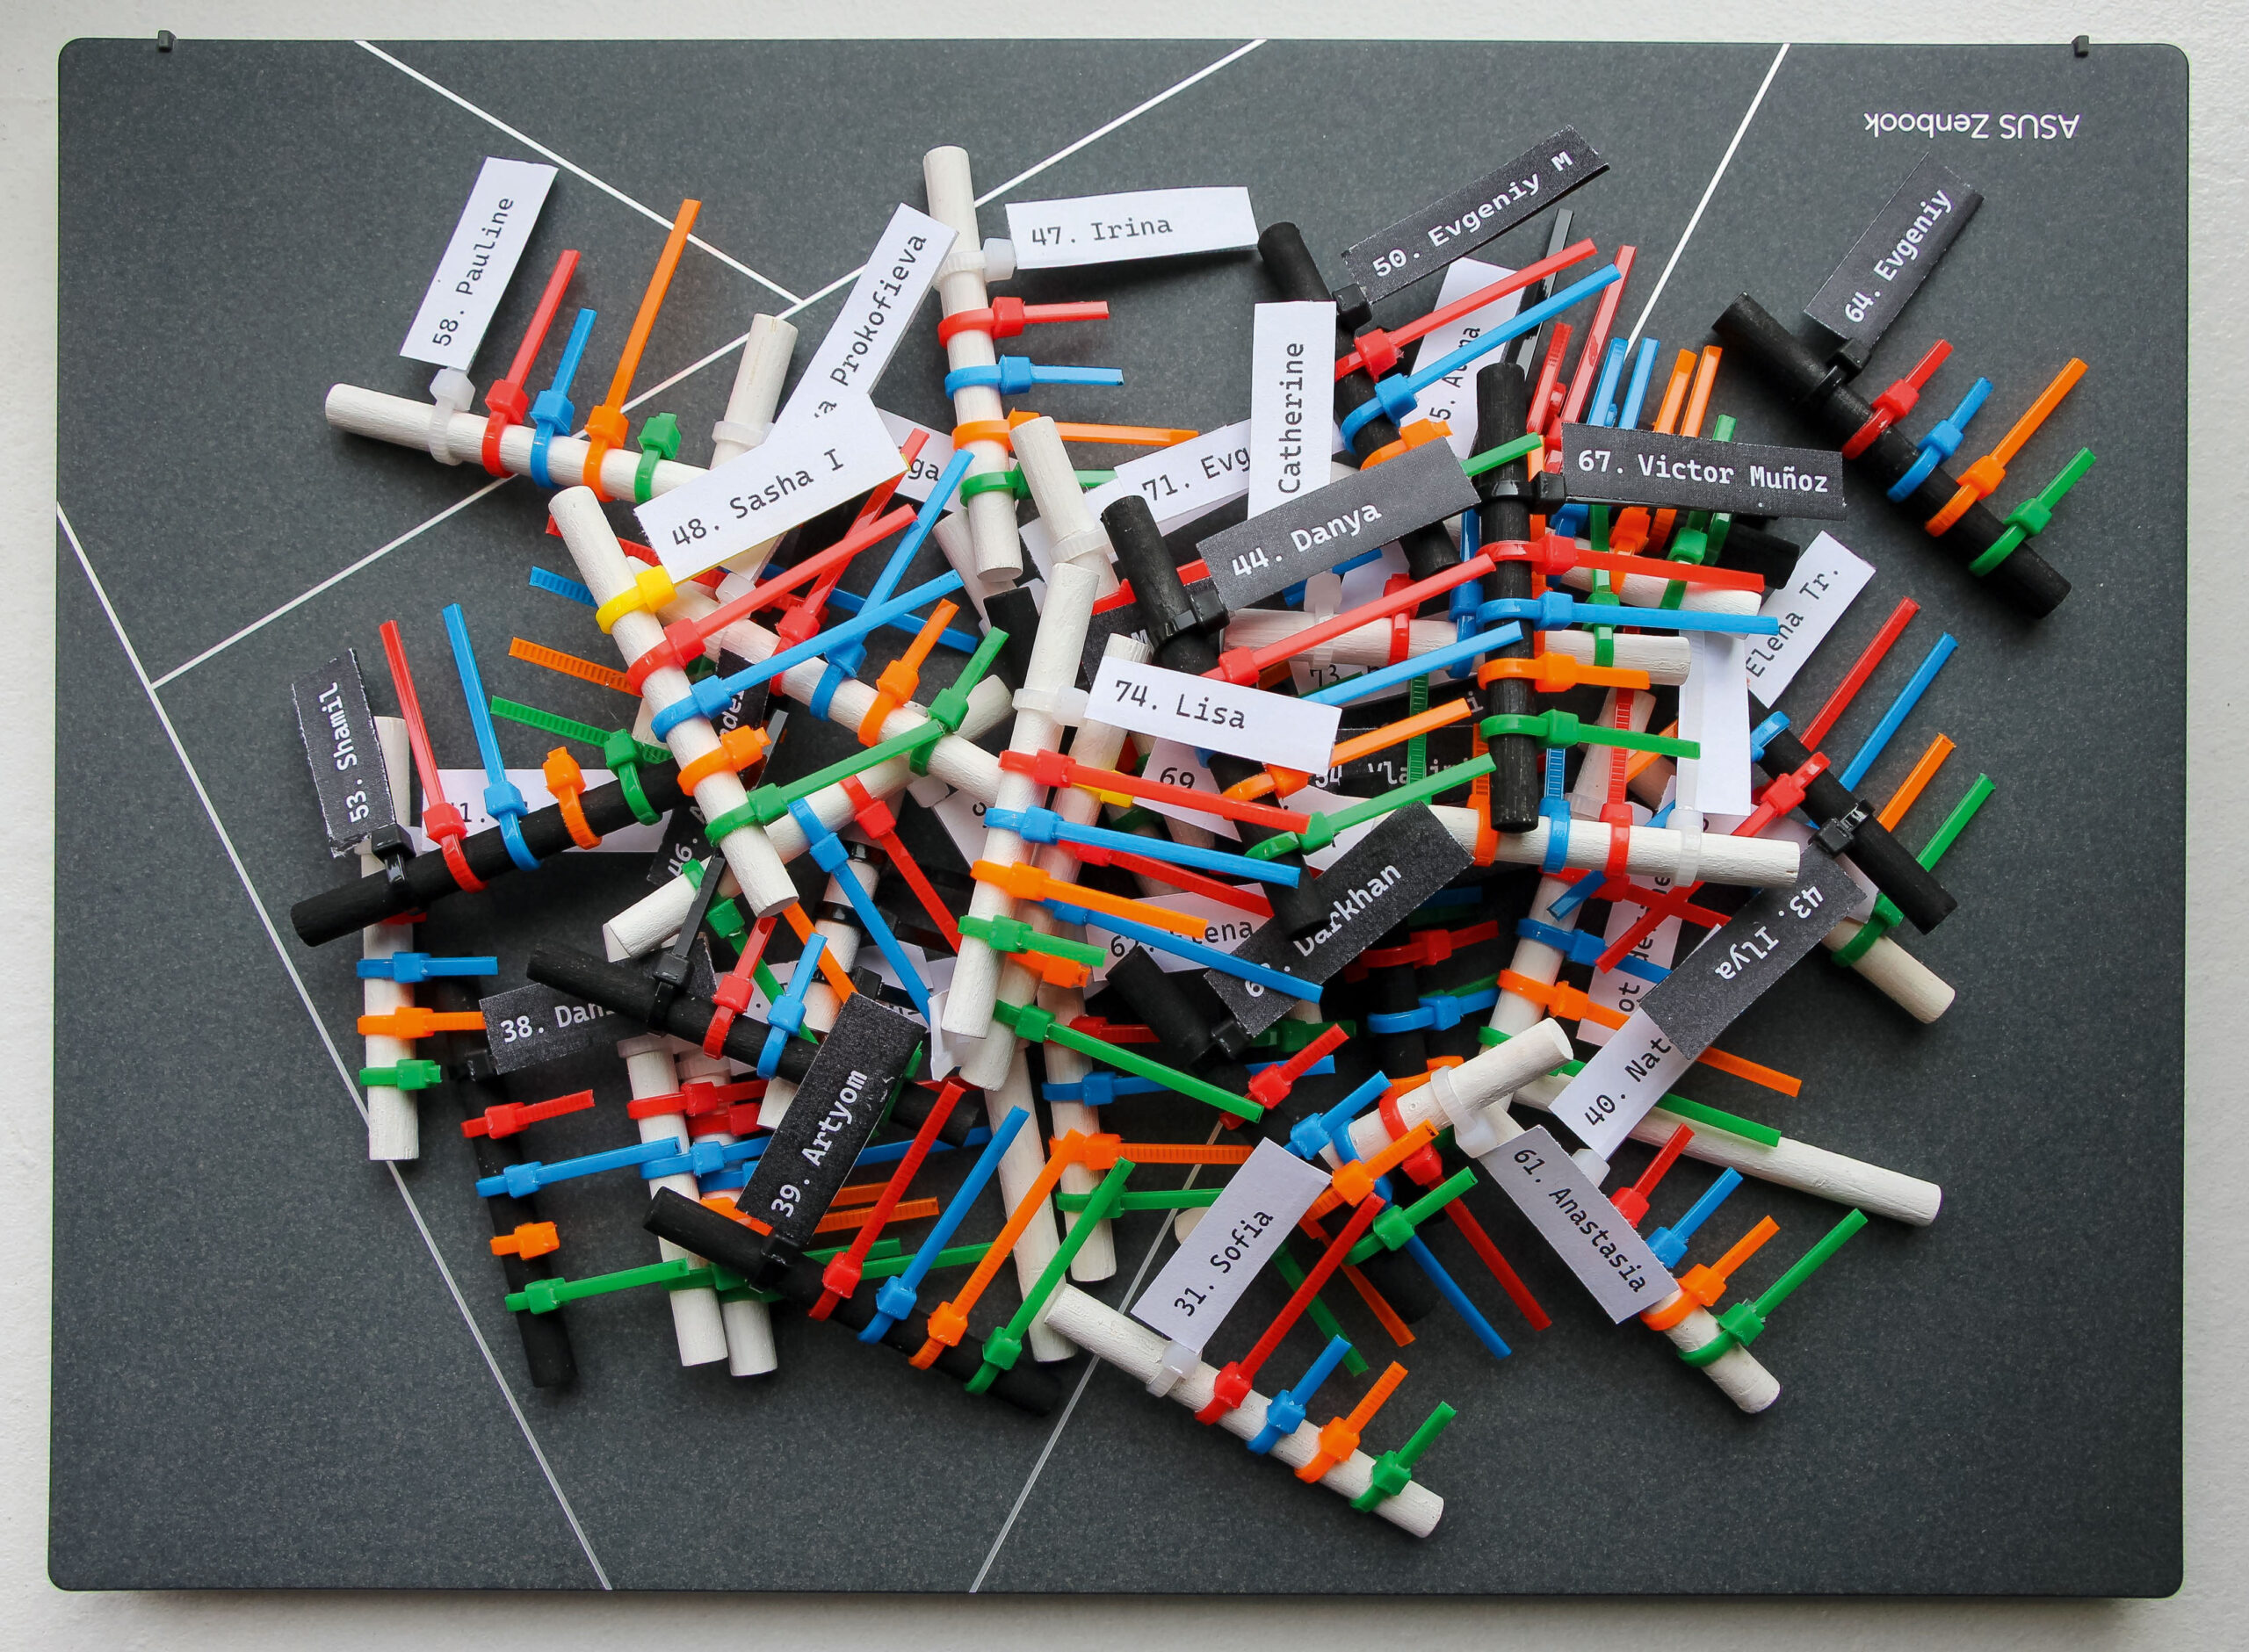
One stick = one participant.
Everything else fell into place: gender represented by the color of the stick—black or white, painted with gouache. Labels repeated this info. At first, I tried writing names with a gel pen, but eventually moved to printed labels.

The result
I tried different layouts for the finished sticks. You can’t twist them too much—names become unreadable, lighting matters, shadows too. The final shot of the stick layout became the data art piece. The legend was made in Figma, and the whole composition was assembled there too.

The data art includes information from just a portion of the community—it’s grown a lot, and photographing the full dataset in one frame was technically impossible at home. I really didn’t want to use photo compositing. I added numbers to the printed name labels so participants could find themselves quickly, since names repeat. The whole process took about two weeks.
The sticks themselves turned out charming, and during our offline meetups I can hand them out to participants. They’re nice to touch and sort through—each with its own texture. Honestly, I didn’t want to put them down. But all things end—and the data art now fits neatly into a small box from a gadget.

I’ve seen breathtakingly beautiful projects shared in our channel—complex constructions from paper and thread, beads, even 3D-printed pieces, and what amazed me most—made of clay.
I couldn’t wait to share my result. I didn’t expect the post in the community to get so many comments and positive feedback on my modest effort. A short moment of fame—delightful and inspiring.
Now I’m thinking of making something material on a socially meaningful topic. To do that, I’ll need to: find the data, come up with an encoding in a specific material, and bring it to life. And in my most ambitious plans—participate in a data viz competition!

Elena Tratsevskaya
I have university degree in both technical and business fields and worked as a project manager in the publishing industry for over 15 years. In 2022, I decided to change my career path and studied BI development, so now I'm creating dashboards and management reports in Power BI. I used to make beautiful art albums but now I create beautiful reports. I see importance not only in the accuracy of information but also in the aesthetic appeal of dashboards. This is where my interest in Data Art comes from.


