
In the past, international investments were the privilege of a select few with the resources to overcome the high barrier of entry. They were generally the wealthy looking to grow their assets, businesses seeking to expand market reach, or government agencies engaged in strategic economic partnerships. Of late, these high barriers to international investments have gradually eroded, ushering in an era of unprecedented economic integration.
Network analyses supply promising tools for uncovering the intricate connections in global financial flows. In this writing, by viewing the world of investment as a network of galaxies, we will explain the characteristics of the newest regime for international investment.
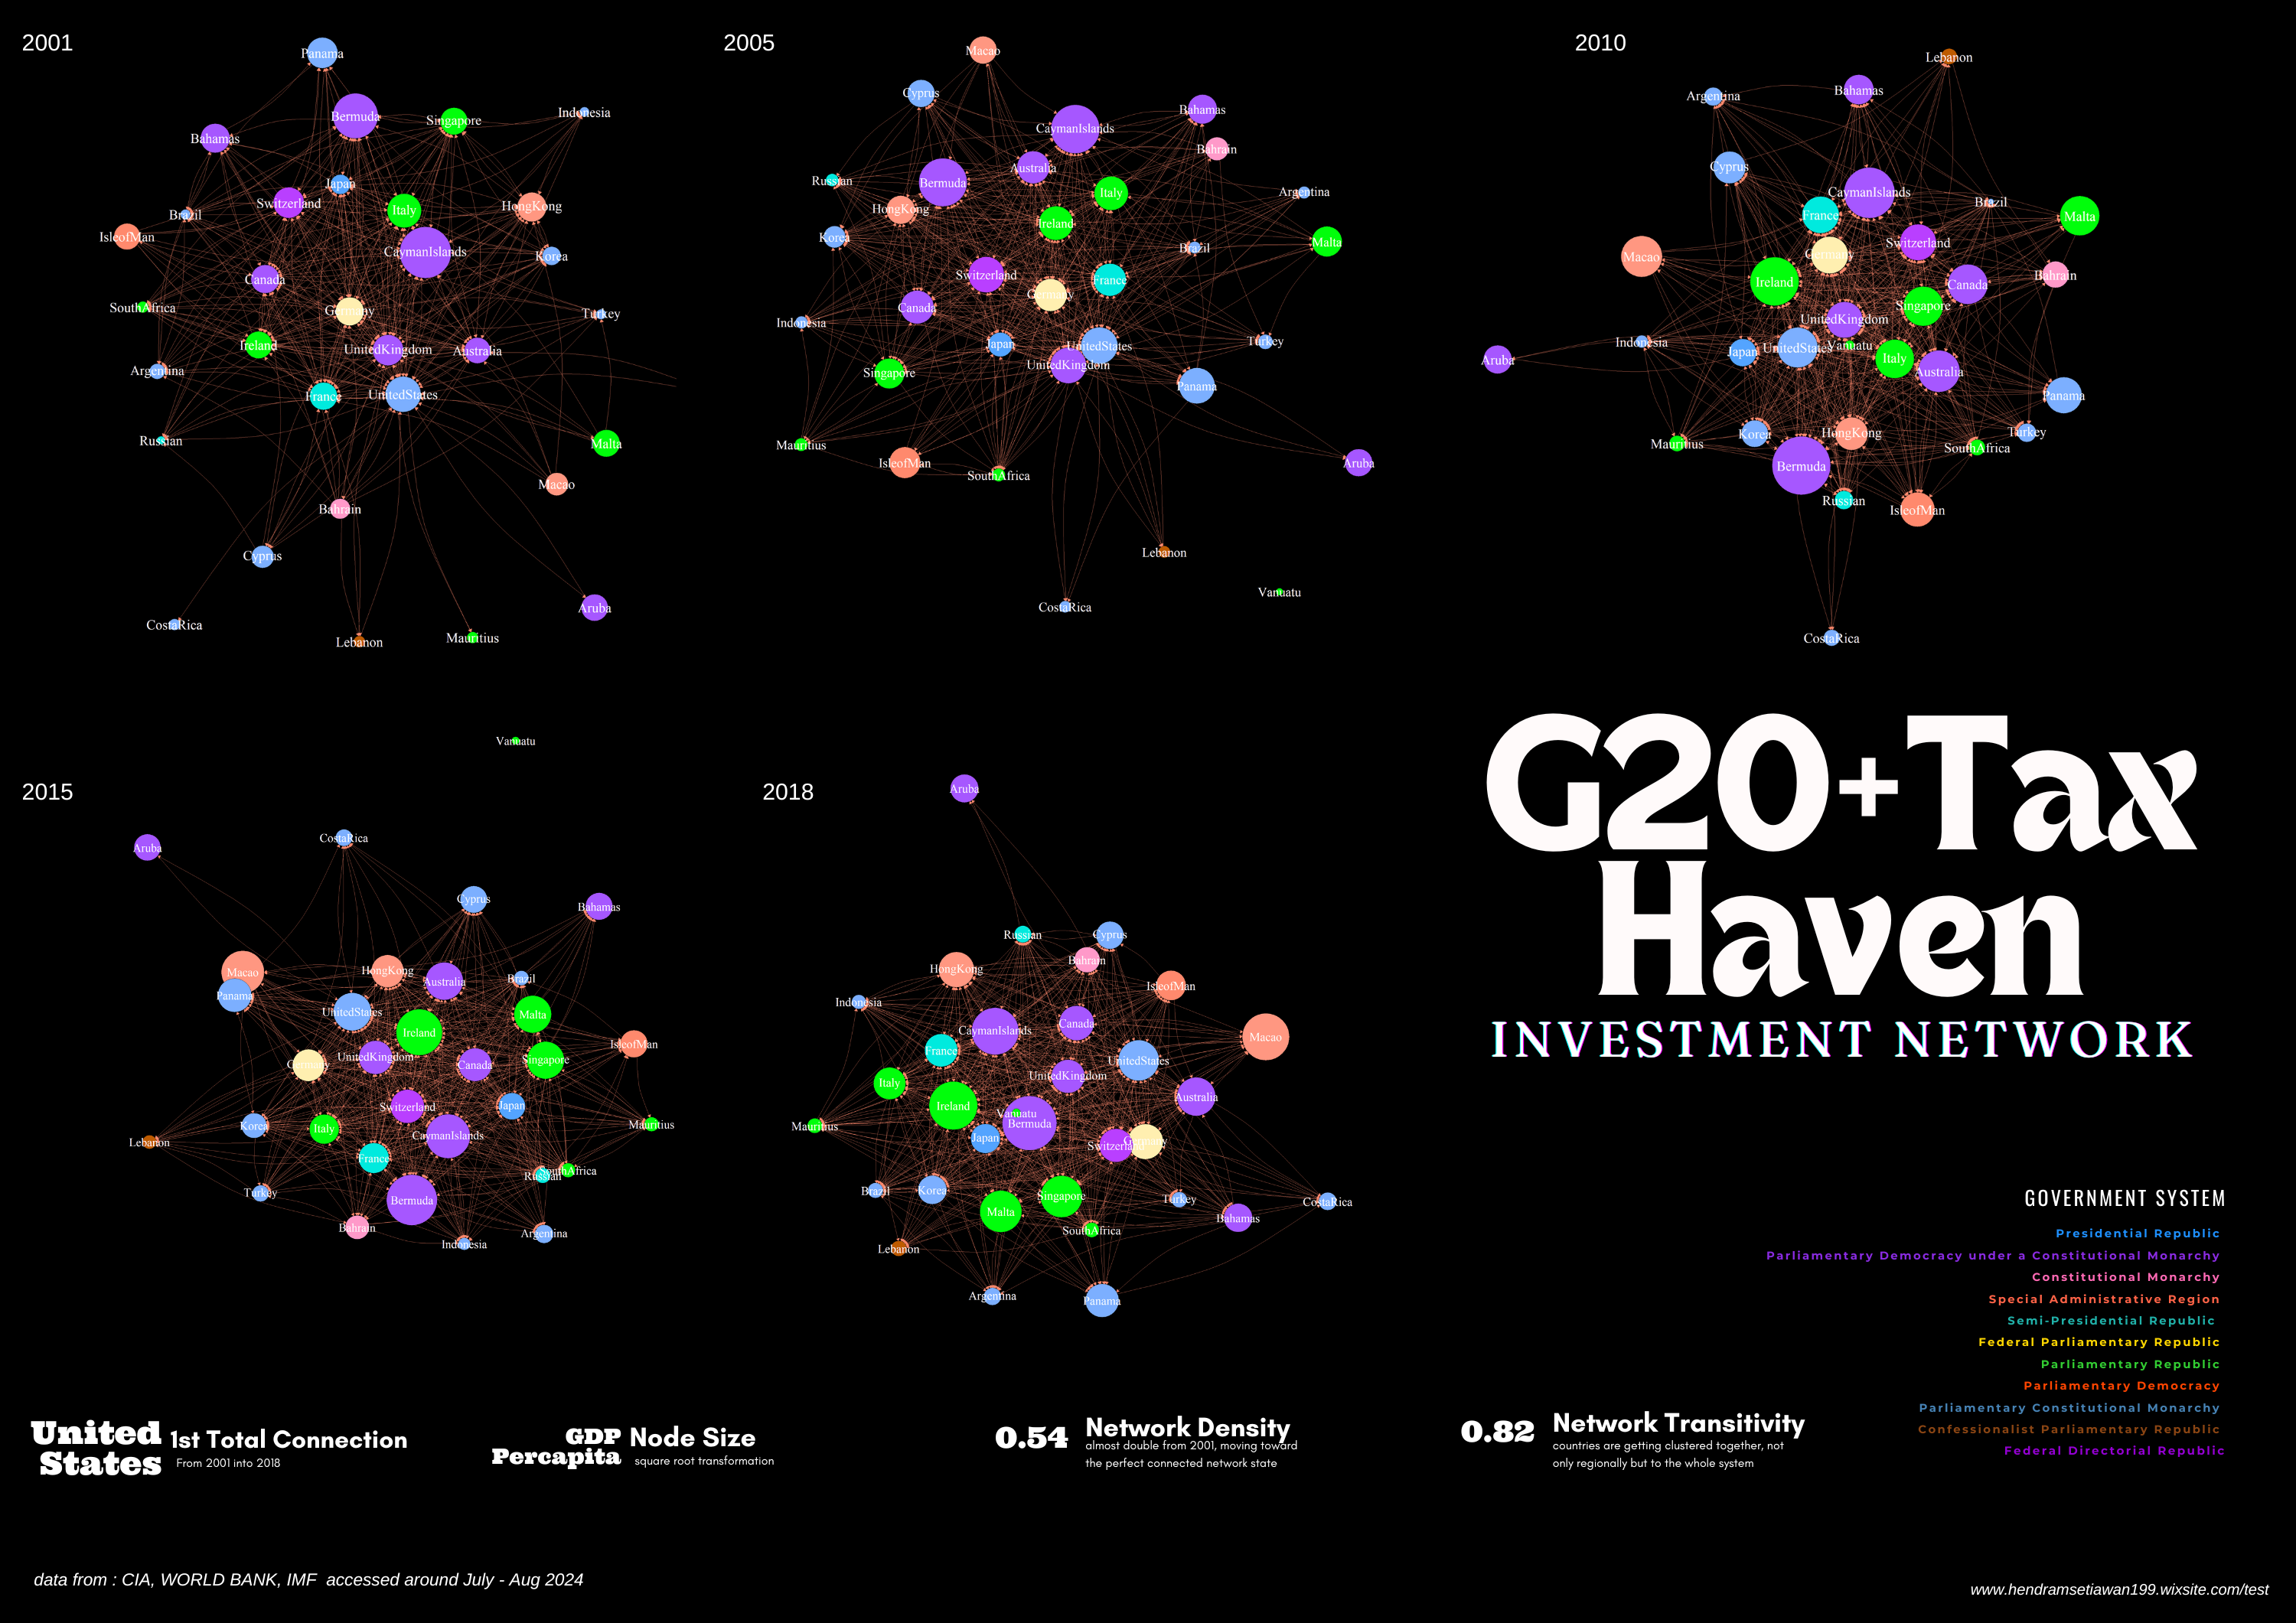
We focus on two major groups: the G20 and tax haven countries. The G20 are countries with money, while “tax havens” are the ones with the means to attract investment. Countries will serve as nodes and amounts of investments will act as edges that connect the universe of countries (please see Table 1 and Figure 1).


Fragmentation to integration: a sniff of the ultimate stability
The democratization of international investment compressed the global financial landscape into an essentially smaller space. This has led to increased connections between countries, reducing “financial” distances or aloofness, triggering a more integrated investment network. While this integration speeds up capital and profit creation, it simultaneously makes financial stability more fragile, where a single shock carries a potential to spread quickly throughout the system.
The clustering coefficient quantifies the tendency of nodes to cluster, reflecting the likelihood that countries will invest in or receive investments from one another. From 2001 to 2018, the rising clustering coefficient (Figure 2) indicates that countries have become more closely clustered, and a denser network suggests that barriers to entering the international investment market have lowered.

The trajectory of the clustering coefficient increased neatly from 0.68 in 2001 to 0.80 in 2018 showing that G20 and Tax Haven countries are rapidly moving toward becoming one integrated system.
Additionally, the increase in network density supports this hypothesis. In 2001, the density was 0.33, indicating that only 33% of all possible connections were realised. By 2018, this figure had risen to 0.55, surpassing the halfway mark.
While the overall pace of integration has accelerated, we predict it will decelerate as the investment world approaches a ‘perfect small world’ state, which is similar to the “small world-ness” from a Watts and Strogatz study. In this state, all countries will likely encounter the law of diminishing returns. While the local, micro properties (like degree) around specific countries may fluctuate minimally, the overall, global properties of the network (such as the clustering coefficient or the density) will likely remain relatively stable in this perfect state. The ‘perfect small world’ hypothesis requires more rigorous testing to confirm its statistical validity. We are in the process of settling this through the more theoretical works we began in Setiawan and Bhaduri.
The race to become the sun or the black hole
Before the network reaches its “perfect” state and attains a connective “saturation” or an equilibrium, so to speak, countries will do whatever it takes to become financial hubs and attract investment. Despite the risks, economic advantages of being a financial hub are compelling. Policymakers are hungry, for example, to access cheap capital, attract investments, stimulate economic growth, create jobs, and drive economic booms. The countries, as a result, compete to become financial hubs or a major source of investment, which help place them at the centre of the universe.
The bump charts in Figure 3 below record the cruciality of each country over the temporal networks – cruciality measured in a variety of ways. We record multiple centrality measures such as Total Degree, Eigenvector, Closeness, and Betweenness. Through each, the United States stay at the top nearly consistently, affirming its continued relevance. However, the rise of Ireland and Cayman Island is a notable success. We are reminded of when the doctor—Valentino Rossi—was still active in MotoGP. Most of the time, the doctor led the race, while other drivers intensely competed for second place. A similar thing happens in the race for the world’s financial centre. The big question is when will the rest of the pack catch up?

To work out which countries are systematically and chronically vital within the investment ecosystem, solid network science—if done innovatively, as we shall show—may augment qualitative hunches, bolstering predictive pathways.
Source of investment: the sun
One of the most important parts of a galaxy is the sun. We aim to identify which countries act like the sun—those with the most connections in the investment network. We treat the total number of investment connections as the lifecycle of the sun, where the size of the node represents the total number of connections, and the brightness of the node represents the total number of outbound connections.
In essence, countries with the most connections will be depicted as the largest suns, while the countries with the brightest sun colours are those with the most outbound investments to other countries.
However, we subtract high outbound connections from inbound connections. If a country has a negative value, it is considered a ‘black hole,’ as it receives more than it emits, making it unsuitable to be classified as a sun. In summary, the agreement behind our analysis is as follows:

This agreement, for 2001, for instance, produces Figure 4.

In 2001, the inner orbit was filled with major players from the G20 (North American Duo (the United States, Canada), the European club (United Kingdom, France, Germany, and Italy), and the Asian nexus (Japan, South Korea, Singapore, Hong Kong)) and tax haven countries (Ireland, the Cayman Islands, Switzerland, and Bermuda). At the second orbit, the graph illustrates a variety of countries, like Russia, the Bahamas, Indonesia, and Panama.
Most of the world’s money passed through the first orbit, and any disruption to its members affected the entire galaxy; it means, in a way, the first orbit is the financial hub of the 2001 galaxy. The members of the first orbit enjoyed substantial economic benefits, which many countries craved. Still, to become part of the first orbit, the size of the economy, seemingly, did not matter, as big economies such as Russia, Indonesia, and Argentina are in the second orbit. Moreover, most tax haven countries are in the second orbit, which indicates that adopting tax haven policies does not guarantee a country will enter the first orbit. The graph suggests that it might need a combination of economic size, tax haven policy, and sophisticated financial market to attract investors. Ultimately, policymakers should navigate multiple policies to orbit the planet to the inner circle.
The visualization uncovers solid, intriguing facts. The thresholds laid out in Table 1 may be altered, but the broad findings detailed below will stay unchanged. In the investment galaxies, larger sizes represent higher connectivity, while brighter appearances indicate a greater role as a source of investment. The fact that the United States is the largest and brightest “sun” reinforces the belief that it is the centre of the financial world. However, the graph reveals that the United Kingdom, the second largest investment hub, acts not as a sun, but as a black hole, with a negative difference between the inflow and outflow of connections. This also indicates that the United States acts more as the hub’s planet, while the United Kingdom, more like the final destination.
Upholding their reputation, Switzerland, Singapore, Bermuda, and Ireland found spots in the inner circle. However, most tax haven countries, such as Ireland, the Isle of Man, and Bermuda, became black holes. Interestingly, the Cayman Islands was the only tax haven with higher levels of outbound investment than powerhouses like Switzerland, Japan, Korea, and Italy. This solidifies the financial hub status of the Cayman Islands, through which money could have moved to another country.
2001 was the peak of Brazil’s economic power. The network brings out Brazil as the smallest, yet the brightest sun, indicating that it became a source of investment despite not being highly connected. Similarly, a well-known country like Russia was less connected than Hong Kong, Argentina, and Brazil, possibly due to its reliance on hubs such as Ireland and the Cayman Islands.
In 2018, to showcase the success of the policy makers, the network switched to Figure 5.

Regarding a black hole, we define it as a country with a negative degree of investment connection when comparing its role as a source and a final destination of investments. Tax haven countries might initially come to mind as those serving as black holes since they often act as destinations for investment or places to where money flows. However, in 2001, the United Kingdom emerged as the largest black hole. This finding suggests that the United Kingdom may have served as a gateway for investment to Asia or other regions outside Europe. This hypothesis could be explored further through clustering analysis.
Similarly, Ireland, Canada, Switzerland, and Singapore live up to their reputations as financial destinations. Both graphs highlight that Singapore and Switzerland are significant players, primarily as final destinations for investment rather than as sources.
Money storage of the world: the blackhole
With the agreement for a blackhole (Table 1), we can draw the following graph (Figure 6).

A black hole is defined as a country with a negative investment connection when comparing its role as a source to its role as a destination (i.e., out degree-indegree). In 2001, the United Kingdom was the largest black hole—a stark contrast to its European neighbours France and Germany, which serve as suns in the investment galaxy. On the other hand, Ireland, Canada, Switzerland, and Singapore fulfil their roles as financial destinations. While Singapore and Switzerland are significant players, they act more as destinations rather than sources of investment.
We offer below a more detailed chronology. Data are available from our GitHub pages.
Acknowledgements
This work was supported, in part, by the Research Enhancement Grant awarded to the second author by the American Mathematical Society and the Simons Foundation for the 2024-2027 cycle. Bentley University’s summer research grant is also gratefully acknowledged.
Further Reading
The Architecture of Complex Weighted Networks by Alain Barrat, Marc Barthelemy, Romualdo Pastor-Satorras and Alessandro Vespignani
Spotting the stock and crypto markets’ rings of fire: measuring change proximities among spillover dependencies within inter and intra-market asset classes by Setiawan and Bhaduri
Collective Dynamics of ‘Small World’ Networks by Watts and Strogatz

Hendra M. Setiawan (hendra.msetiawan1991@gmail.com) is currently serving on the ISACA Indonesia Board of Executive in Research and Education. Hendra is an aspiring data scientist driven by the desire to create policy-based insights grounded in science and data analytics. His goal is to craft a beautiful science that not only drives transformation but also captivates and resonates with people on a personal level. Trained in multidisciplinary modelling and business at Bentley University, Hendra discovered his passion for mathematical modelling, machine learning, and social network analytics. He believes research combined with storytelling through data is the most powerful way to change the world.

Moinak Bhaduri (mbhaduri@bentley.edu) is currently a tenure-line Assistant Professor at the Department of Mathematical Sciences, Bentley University in Massachusetts. His faculty page is https://faculty.bentley.edu/profile/mbhaduri Rooted in applied probability, he studies spatio-temporal Poisson processes and others such as the self-exciting Hawkes or log-Gaussian Cox processes that are natural generalisations. His primary interests include developing change-detection algorithms in systems modeled by these stochastic processes, especially through trend permutations. Moinak heads the editorial board of the NextGen column of the New England Journal of Statistics in Data Science.
-
Moinak Bhaduri

-
Moinak Bhaduri

-
Moinak Bhaduri

-
Moinak Bhaduri


