
For over half a century, science centers have been key in communicating science, aiming to increase interest and curiosity in STEM, and promote lifelong learning. Modern science centers integrate interactive technologies like large-scale dome displays, touch tables, VR, and AR to foster immersive learning. Visitors can explore complex phenomena, such as conducting a virtual autopsy using digital replicas. Also, the shift towards digitally interactive exhibits has expanded science centers beyond physical locations to virtual spaces, extending their reach into classrooms.
Our investigation of what defines a successful visit to a digital science center revealed several key factors for impactful school visits involving interactive data visualization. Immersive encounters, such as full-dome movies, provide unique perspectives about vast and microscopic phenomena. Hands-on discovery allows pupils to manipulate and investigate data, leading to deeper engagement. Collaborative interaction fosters active learning through group participation. Additionally, clear didactic connections to the curriculum ensure that visits are pedagogically meaningful.
We propose a three-stage model for designing school visits. The “Experience” stage involves immersive visual experiences to spark interest. The “Engagement” stage builds on this by providing hands-on interaction with data visualization exhibits. The “Applicate” stage offers opportunities to apply and create using data visualization, advancing active participation in science. A future goal of applying the model is to broaden STEM reach, enabling pupils to benefit from data visualization experiences even if they cannot visit physical centers. This approach will incorporate digital tools seamlessly into classroom practice, making science education more accessible and engaging for all students.
What is the purpose of school visits to science centers?

For more than half a century, science centers have become an important vehicle for science communication to the public and school pupils. A premier example in San Francisco is the Exploratorium conceived by Frank Oppenheimer in the 1960s. School visits to science centers are assumed to help increase pupils’ interest in STEM and contribute to lifelong learning. Typically, science centers feature hands-on and discovery learning approaches in attempts to spark curiosity and interest in science. The explosive growth of computer science and technology during the last decades has enticed a transformation in science communication towards the emergence of more digital and interactive exhibits, often based on data visualization. The educational and outreach landscape needs a fresh lens on how today’s data visualization technology can support and boost learning and interest during school visits to modern science centers.
What is a digital science center?
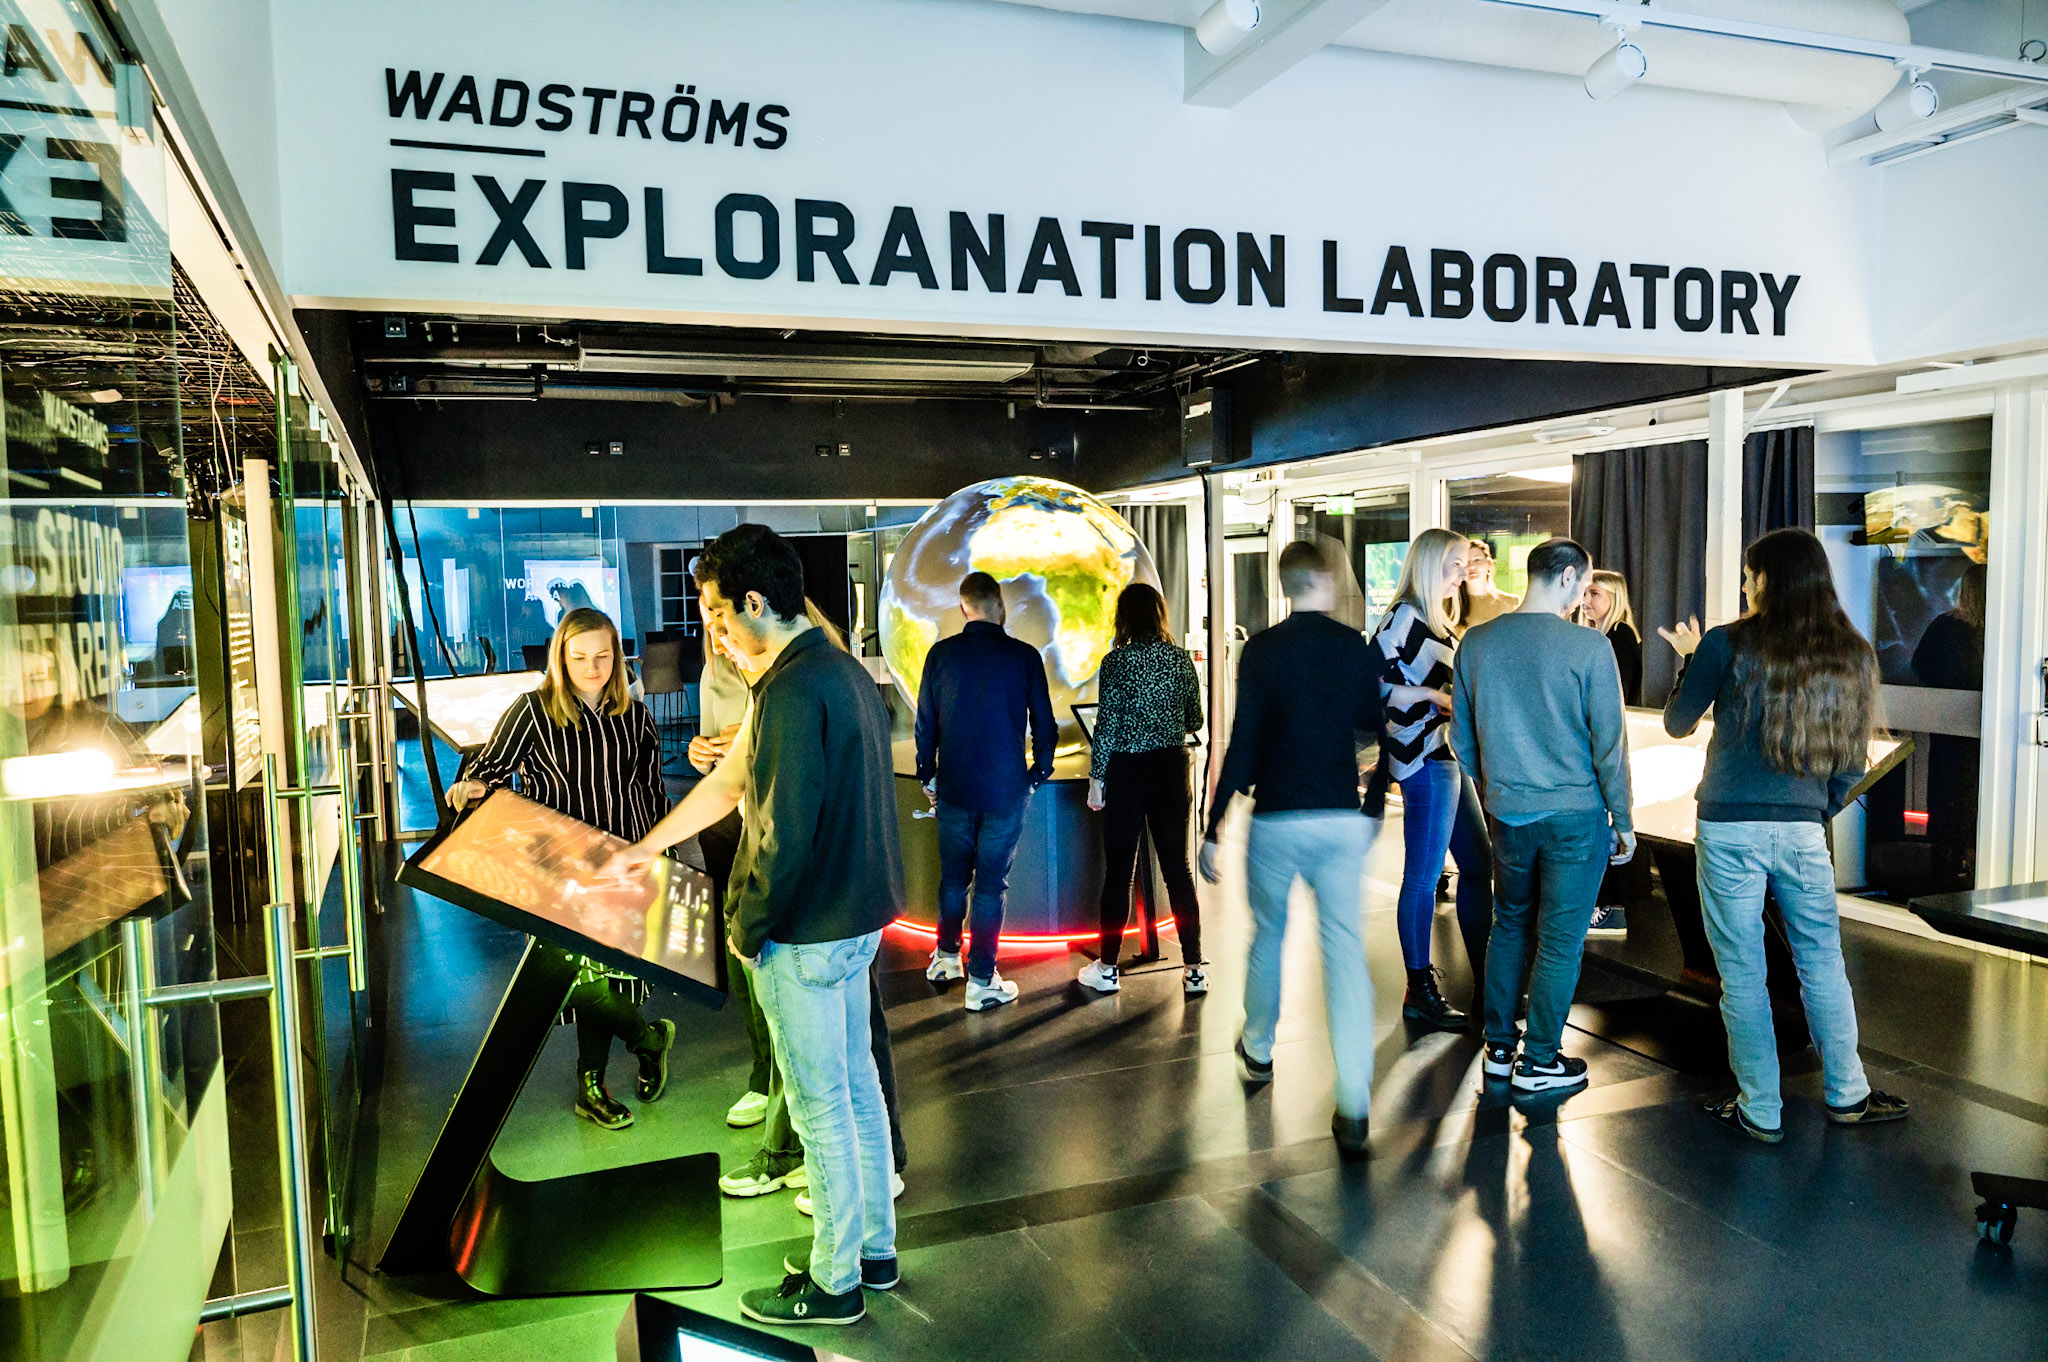
Contemporary science centers integrate interactive technologies such as large-scale dome displays, touch tables, virtual reality, and augmented reality to create immersive and engaging learning experiences. Data visualization can reveal complex and otherwise unobservable dimensions of reality, such as entities that are too massive, too small, or phenomena that are too fast or too slow to be perceived with the naked eye. Interactive data visualization can provide visitors with opportunities for hands-on exploration of the same data as scientists. For example, consider the interactive exploration of a human body by conducting a virtual autopsy—interacting with a true digital replica.

The shift towards digital and interactive data visualization also redefines the boundaries of science centers as not only physical locations but also as virtual spaces that can extend into classrooms through internet and cloud-based exhibits. For example, we have brought computing intensive interactive data visualization such as the interactive human body into classrooms through cloud-based solutions, providing pupils with a one-to-one exploration of science center exhibits. Such remote access can foster much sought-after integration between school visits to centers and classroom practice in novel ways, and where exploration can continue post-visit in the classroom, or from anywhere in the world.
An example of a public space containing many such elements is the Visualization Center C located in Norrköping, Sweden. The center provides experiences with digital interactive visualizations for visitors to perceive, comprehend, and uncover scientific explanations about our complex world. As part of a dynamic hub that interconnects research, innovation, and outreach, the center offers a range of school programs, with more than 100 classes or 3,000 pupils visiting the center annually.
While pupils and teachers often expressed enjoyment when visiting this science center, we desired a more in-depth and systematic understanding of what factors define a successful visit. Over three years, and as part of this pursuit, we employed a suite of observations, surveys, and interviews to identify success factors that make data visualization impactful during school visits to a digital science center.
What are examples of success factors?
Our research has discovered several key success factors that teachers, pupils, and science center educators believe are crucial for a successful visit. While many of these are related to broader aspects of school visits to science centers and museums, the following specifically focus on the integration of interactive data visualization:
- Immersive encounters like viewing a full dome movie offer unique encounters with the macroscopic (e.g., deep space) and submicroscopic (e.g., molecular interactions), which emphasise relative size and presence. Pupils typically state “getting a feeling for the vastness of space” and “how small humans really are.”
- Hands-on discovery through interactive manipulation and investigation allows for exploration and making predictions. In such cases, pupils prefer to engage in their own hands-on explorations in addition to only passively receiving information from a guide or educator.
- Collaborative interaction provides a social dimension where pupils’ group and collaborative participation with interactive data visualization fosters active learning. Such observations are also typically reinforced by science center educators, which in turn has implications for future exhibit design.
- Didactic connections where clear links to curricula and integration with classroom practice are essential for embedding the teaching context. Explicitly developing these connections allows the visit to transcend beyond a mere “fun”, “different”, or “out-of-class” event.
How can we model school visits of the future?
Uncovering a range of success factors has informed a three-stage model for how school visits to digital science centers could be designed for different pedagogical and communicative purposes. An overview of the model by specifically interpreting its implications within the context of interactive data visualization in a digital science center is as follows:
- “Experience” stage – view a fulldome 3D movie that presents an immersive visual experience of complex phenomena related to STEM. An example could be a visual portrayal of how data visualizations are applied in visual effects. This could be followed by a guided tour of data visualization exhibits depicting how visual effects are created and used in film and computer games. The experience stage is coupled with visual storytelling techniques that stimulate interest and curiosity about STEM topics, which provide a foundation and motivation for the second and third stages of the model.
- “Engagement” stage – specifically builds on “experience” by integrating opportunities for hands-on interaction and exploration of data visualization through different exhibits. As an example, such engagement could require critical visual literacy skills, such as learning about different forms of representation, and being able to discern strengths and limitations of diverse visualization.
- “Applicate” stage – denotes opportunities to apply and create through data visualization. Possibilities include tasks such as confronting a real-world problem, or creating a novel solution where pupils take ownership of what questions are pursued. Examples could involve performing data visualization experiments—such as visualizing climate change trends—by drawing on the unique interactive technologies of the science center. Importantly, this stage is exemplified by pupils “doing science” rather than merely “learning about science”. In doing so, pupils make informed decisions about data selection, collection, and visualization, which in turn also complements the development of visual literacy skills.
How can the model inform design of data visualization experiences?
We are of the opinion that the three-stage model can help design and implement pedagogically successful school visits to science centers and museums. The model could also facilitate the explicit linking of school visits to STEM interest, curiosity, and learning. We are currently implementing the model in several research projects wherein it will be further validated, developed, and refined.
In one example, we tested the applicate stage in the context of entrepreneurial learning with data visualization technology in a joint development project between the science center, the Swedish Science Center Assocation, and the Swedish Agency for Education. The preliminary results showed an increase in pupils’ entrepreneurial skills in relation to digital competence, collaboration, and self-efficacy. Currently, we intend to incorporate all three stages of the model in an outreach project termed “TellUS—the talking planet” that renders an interactive spherical visualization of Earth in combination with AI-supported dialogue. The model will inform an outreach program aimed at increasing science capital of pupils by developing replicable educational activities aimed at 7 – 14-year-olds across Sweden.
We see the ultimate importance of our work as broadening the reach of STEM education, allowing pupils who do not have the opportunity to visit physical centers to nevertheless benefit from the potential power of data visualization experiences.
Further reading
Visualization Center C: https://visualiseringscenter.se/en/

Andreas Göransson
Andreas is a postdoctoral researcher in science education with Linköping University. His research focuses on visual learning and communication applications for science education and outreach in both formal and informal settings. He is a biologist and former science teacher and is currently engaged in research, teacher training and public science communication at Visualization Center C in Norrköping.

Konrad Schönborn
Konrad, a professor at Linköping University, explores how visualization impacts learning and communication. His research spans visualization, educational science, cognition, and design, with the aim to enhance learning experiences in public spaces and classrooms.

Lena Tibell
The molecular world is too small to be seen directly by the naked eye, and their interactions are often too complex to be perceived. Instead, various visualizations and integration of interactive technologies, such as largescale dome displays, touch tables, virtual reality, and augmented reality, are used to create immersive and engaging learning experiences. My research interest is to understand how, and under what circumstances, such experiences can support different communicative purposes.


