
This content originally appeared as part of The ‘Gale, Nightingale’s biweekly newsletter.
Michael Brenner is the Head of Design at DATA4CHANGE and the creator of Viz in the Wild, an Instagram-based collection of “unseen, overlooked, and often missed” expressions of data.
1. What is one visualization that has inspired you and why?
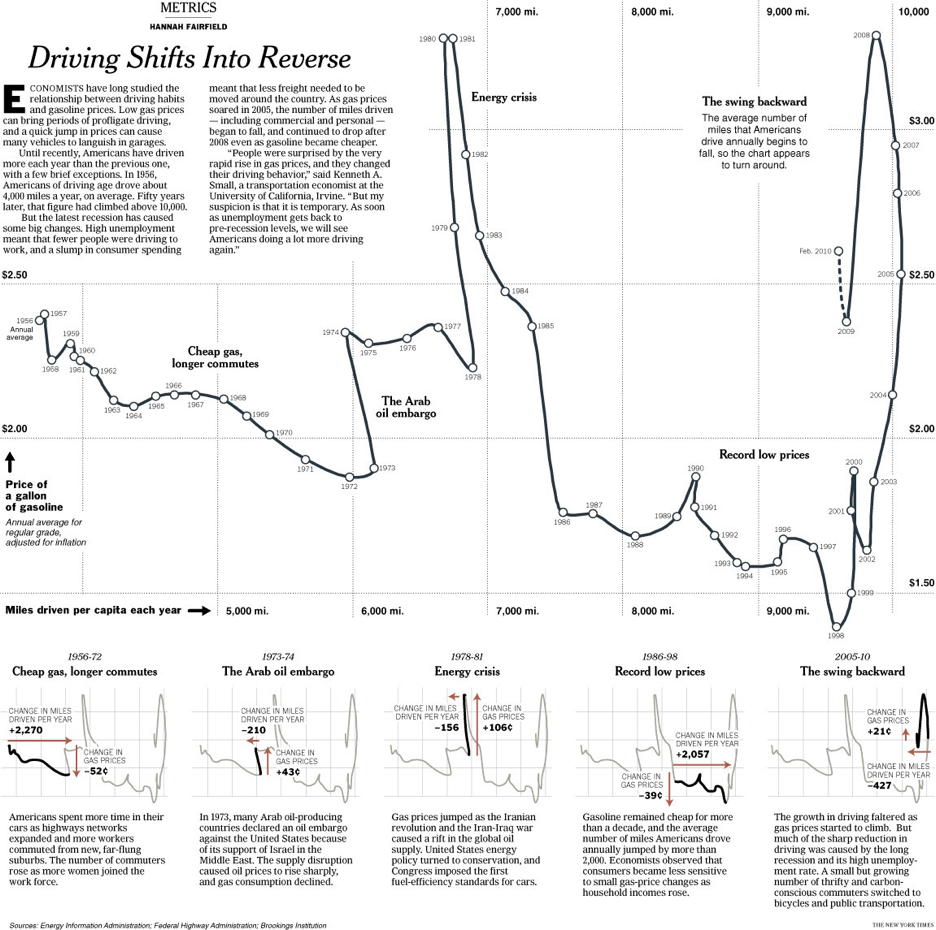
Hannah Fairfield’s 2010 New York Times chart and piece that explores the relationship and trends of driving habits and gas prices. When I first saw this, I was like, wtf you can do this? Mind you, this was from a period that was reigned by a certain type of approach to data design and there were only a few voices who dominated the space. But what really blew me away was the arrangement of time and how it completely and perfectly lifted the story from the data. This is the chart that gave me the courage to explore how we can layer in many more dimensions/variables into designs to tell more powerful stories.
2. What’s one topic you would love to visualize but have never had the chance to?
I love to cook. I’ve had on the back burner forever exploring what ingredient combinations or specific types or classifications of dishes lead to Michelin stars, and how that compares to shifts in tastes over time. There was a period where producing food as foam was a big thing. I might start there…
3. If you had to choose an entirely new career path, realistic or not, what would it be?
I’ve always pondered this, and when I do, I always come back to photojournalism. A photojournalist. I’m not great with words, so I’d let the pictures do the talking!
Claire Santoro is an information designer with a passion for energy and sustainability. For 10 years, Claire has worked with governmental agencies, non-profit organizations, and higher education to accelerate climate action by communicating complex information in an engaging, approachable way. Claire holds an M.S. in environmental science from the University of Michigan.
- Claire Santoro

- Claire Santoro

- Claire Santoro

- Claire Santoro


