
Systems thinking is fundamental for understanding complex problems. Addressing twenty-first century challenges like climate change requires comprehending how different components of Earth systems influence each other. The carbon cycle, crucial to our planet’s climate system, is a powerful context for helping the rising generation develop systems thinking skills. Traditional 2-D static images often fail to convey the complexities of the carbon cycle, making it challenging for learners. These representations do not communicate dynamic features of the carbon cycle, such as its multiple scales and interconnected processes. We hypothesize that interactive visualization can aid learning by enabling dynamic exploration and consideration of human impacts, thereby fostering systems thinking.
Personalized learning paths guided by adaptive visualization could also support individual progress. Despite growing interest in interactive data visualization, there is little research on designing these tools for meaningful integration into teaching about systems thinking. The development of Tracing Carbon aims to bridge this gap and targets junior high school students. Using an iterative design-based approach, we combined systems thinking theory, cognitive learning principles, and carbon cycle knowledge, and involved teachers and students in the design process.
Introducing Tracing Carbon to teachers and collaborating on its classroom integration revealed that digital tools must align with educational goals. Our work demonstrates how the intersection between design and science education creates research opportunities for enhancing learning experiences. The development of Tracing Carbon paves the way for future research on how students of different ages use visualization and how adaptive learning environments can enhance visual learning environments for STEM education.
Why is thinking about systems important?
Systems thinking is fundamental for understanding complex problems. Addressing twenty-first century global challenges such as digital privacy, world health, biodiversity loss, and climate change all rely on thinking about systems. Indeed, humanity faces the massive task of tackling global warming. To act, we all need to comprehend what is happening—and that requires thinking about how different components of earth systems connect and impact one another. The carbon cycle plays a crucial role in our planet’s climate system, making it a highly relevant and powerful context for helping the rising generation develop systems thinking skills.
Despite the importance of the carbon cycle, our young students are often presented with the sheer complexities of this system with deceptively simple and traditional 2D static images (see below). Many young learners find it demanding to learn about the carbon cycle using conventional visual tools. This is perhaps unsurprising since established and standard visual representations do not necessarily communicate the intricate and dynamic features of the carbon cycle, such as traversing multiple temporal and spatial scales, constituting several subsystems-within-systems, and incorporating multiple interconnected processes. Additionally, these conventional visualizations are not always paired with the scientific data that represents the status of the global carbon cycle and its implication for environmental challenges.

Could interactive visualization foster systems thinking?
In the visualization community, the term visualization is usually acquainted with computer-based visualization systems that augment human decision-making capabilities by providing visual representations of data. Coming from a science education background, we adopt a broader perspective on visualization, by considering it as the representation of information in visual formats such as images, diagrams, or charts.
The carbon cycle represents an abstract conceptual framework in science education that requires grasping multiple layers of information, including system components and dynamic relationships between components at microscopic and macroscopic organizational levels. We hypothesize that a learning environment that represents this information through multiple interactive visualizations can facilitate learning about the complexities of the cycle. Additionally, we believe visual representations of scientific data about the carbon cycle—such as atmospheric carbon dioxide, earth temperature anomalies, and carbon flux—can enrich this learning environment and provide guidance towards evidence-based insights on this topic. By enabling users to dynamically explore and visualize components and relationships of a complex earth system such as the carbon cycle, and motivate consideration of the influence of human impact, this learning environment can foster the development of systems thinking abilities. Furthermore, we believe that as students gradually build their understanding about how earth systems work, personalized learning paths guided by adaptive visualization could support their individual learning progress. In parallel, teachers play a vital role in providing support as students navigate their learning trajectories with such an interactive visual environment. Our work currently pursues the following questions:
- How can we create interactive data visualization tools to help pupils understand how earth systems work?
- What happens when pupils use such visual tools to explore the carbon cycle?
- What are the potential benefits of interactive and adaptive visuals for facilitating systems thinking?
To explore these questions, we apply mixed method endeavors that incorporate data visualization, interactive and visual design, adaptive learning environments, science education, and educational psychology.
How can design intersect with science education in developing Tracing Carbon
Despite increasing inroads into the value of interactive data visualization in science education, there remains a significant gap in research on how to design these tools effectively and integrate them into teaching practice. The development of Tracing Carbon exemplifies a pedagogical effort to bridge this gap, highlighting how design intersects with science education. Targeting junior high school science classes (students aged 13 – 16), we designed an adaptive and interactive learning environment to support systems thinking skills about the carbon cycle. We used an iterative design-based approach informed by theory, teachers, students, and a research team that included educators, designers, and programmers.
We combined systems thinking theory, cognitive learning and carbon cycle knowledge to create the components of the learning environment. We used a hierarchical systems thinking model as a scaffolding framework to develop sequences of learning support for Tracing Carbon, and integrated various learning objectives, tasks and modules to help students understand the carbon cycle. Teachers and students are key in designing learning tools, and science teachers and students were involved in the design process. The research team used their collective insights to guide and refine the design through various focus group meetings, individual interviews, and classroom interventions.
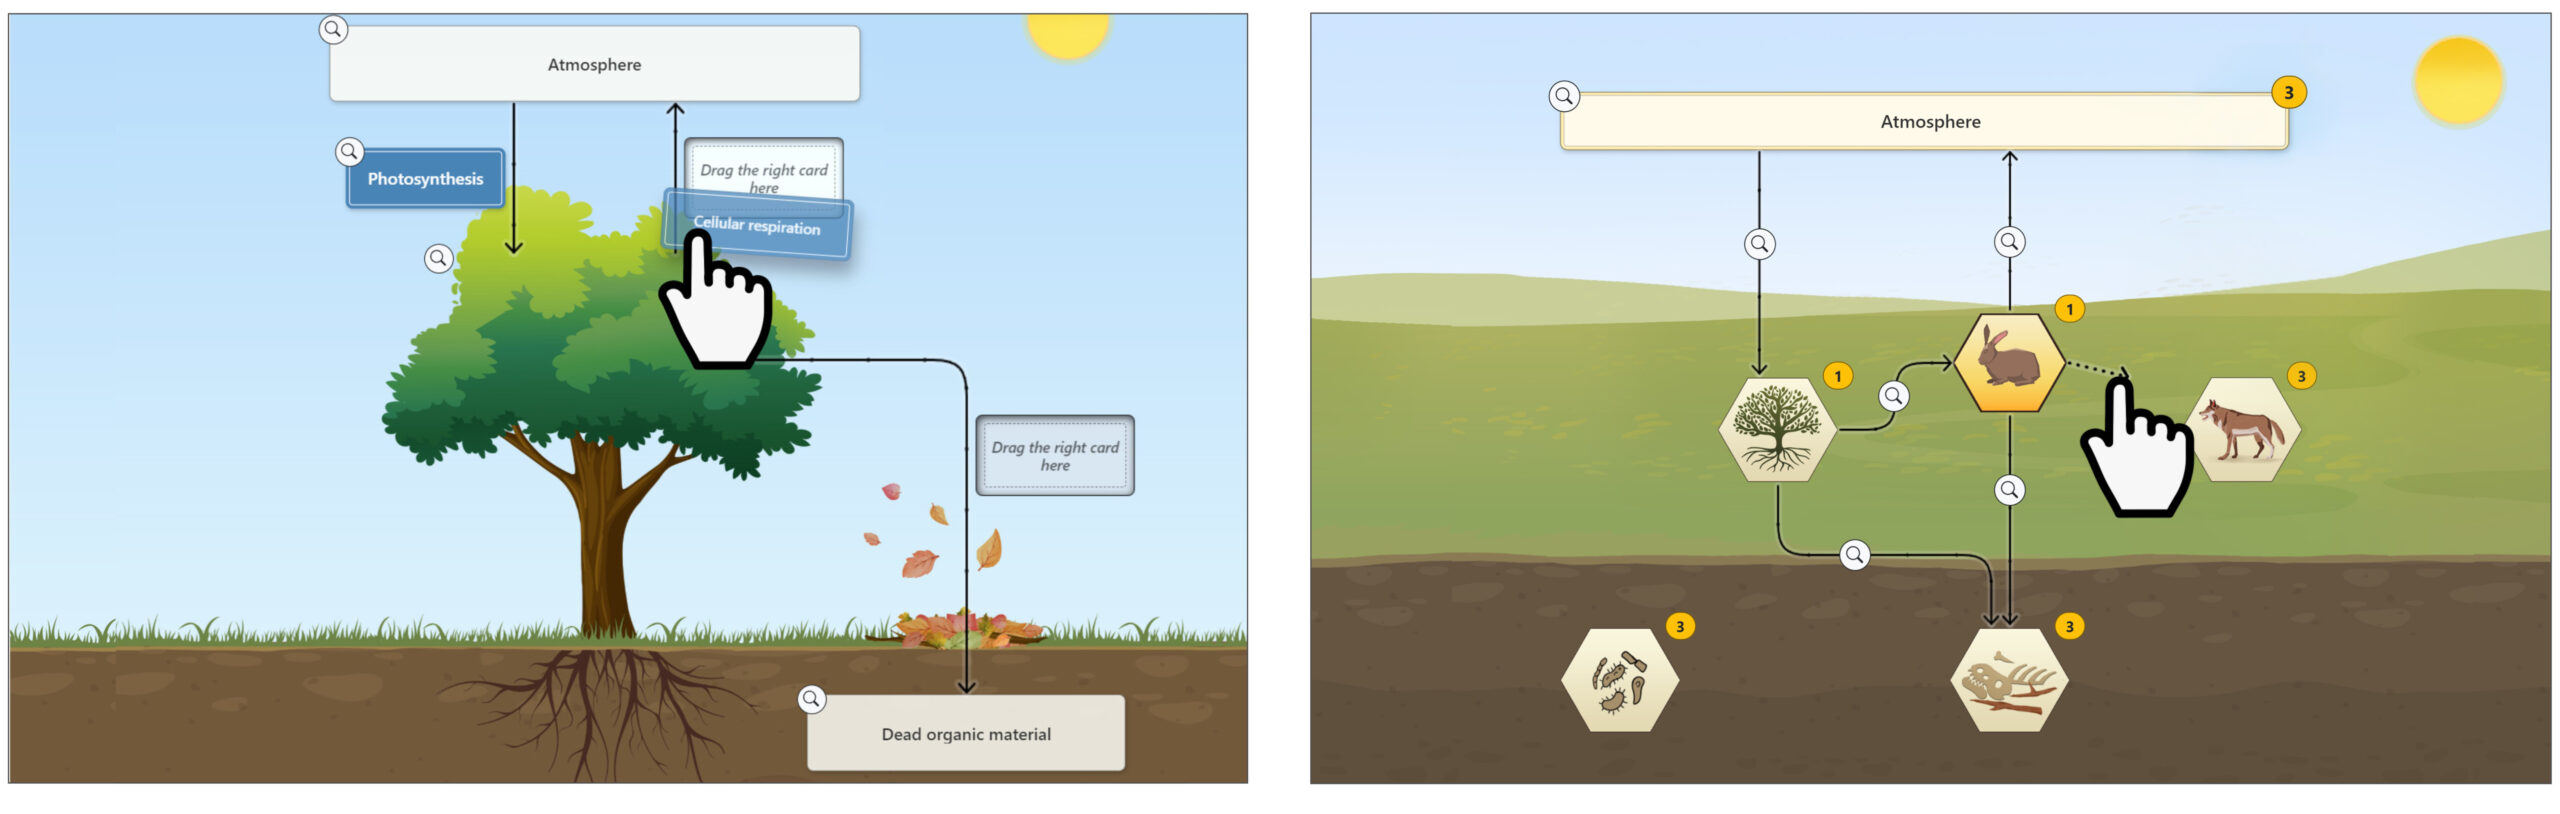
The design process led to Tracing Carbon, an adaptive interactive learning tool consisting of tasks and quizzes across progressive modules. The learning experience starts by exploring the forest carbon cycle by covering carbon pools and transformation processes. Then it focuses on the carbon cycle at the global scale and ends by exploring scientific data on anthropogenic effects on the carbon cycle. Students can engage with Tracing Carbon through various interactions (see below), that include dragging and dropping items to complete images (A) and drawing and completing arrows to “trace carbon” through various sub-cycles (B).

While progressing through the visualization environment, students are presented with quizzes and tasks representing various levels of systems thinking skills, designed to stimulate reasoning and problem-solving abilities. While engaging, the adaptive characteristics of Tracing Carbon personalize the learning experience by adjusting the task and quiz difficulty and quizzes according to students’ real-time performance. Additionally, various forms of visual feedback strive to validate students’ answers and guide them through the learning experience.
What happens when Tracing Carbon is used in the classroom?
Integrating digital tools in classrooms involves much more than merely making them available to teachers and students. It’s about aligning them with educational goals to enhance learning processes and outcomes. Given the diversity of data visualization tools and educational settings, there is no universal recipe for integrating a digital tool into every classroom. However, observing how a specific tool like Tracing Carbon can support systems thinking can illuminate key considerations for implementing similar educational tools in teaching practice.
To date, we have begun introducing Tracing Carbon to teachers and collaborating with them while they integrate it into their teaching. Perhaps unsurprisingly, teachers seek tools to streamline their workload while enhancing students’ learning. A general recommendation is to complement digital tools with additional resources to maximize pedagogical effectiveness. In terms of student experiences, we observed that they generally enjoy using the digital resource and seem to show increased engagement. It follows that harmonizing teaching activities and digital resources is of high pedagogical importance.
Future directions for enhancing systems thinking with data visualization?
We have tested potential principles for creating interactive diagrammatic visualizations that can help learners grasp complex and interconnected science concepts. In this way, we demonstrate how the intersection between design and science education provides a research space where visual tools are crafted with the intention to enrich learning experiences. The developed Tracing Carbon tool is intended to enhance systems thinking as a key aspect that contributes to notions of environmental literacy and informed decision-making. Such integration also provides prompts for how systems thinking could be approached in STEM domains at large. Furthermore, learning and reasoning about fundamental STEM concepts through a visually communicated environment could compensate for differences in pupils’ language proficiency. Lastly, the fact that such a visualization platform can be used in any learning setting equipped with a computer and internet ensures accessibility for all pupils and teachers.
The multidisciplinary collaboration undertaken in this project sets the stage for several future directions. These could involve comparing how students of different ages use data visualization platforms to develop systems thinking, or how such abilities develop over time. The adaptive visualization component of the work also provides insights into how emerging AI can enhance visual learning environments for STEM—in continuing to seek interventions for equipping the next generation with essential knowledge to solve urgent global issues.
Acknowledgements
We heartily appreciate the contributions of our collaborators in the project team Måns Gezelius, Gunnar Höst, Marta Koć‑Januchta, Jonas Löwgren and Lena Tibell. This work is supported by the Swedish Research Council (Vetenskapsrådet, Grant 2020-05147).
Further reading
Conducting Educational Design Research, Susan McKenney and Thomas Reeves
Development of system thinking skills in the context of earth system education, Orit Ben-Zvi Assaraf and Nir Orion
Students’ conceptions of the carbon cycle: identifying and interrelating components of the carbon cycle and tracing carbon atoms across the levels of biological organisation, Katharina Düsing, Roman Asshoff and Marcus Hammann
The fabric of visualization, Elisabeta Marai and Torsten Möller
Visualization analysis and design, Tamara Munzner

Mina Mani
Mina is a Ph.D. student in science education at Linköping University with a background in design and visual communication. Her research focuses on designing interactive visualization resources that support the development of systems thinking skills.

Konrad Schönborn
Konrad, a professor at Linköping University, explores how visualization impacts learning and communication. His research spans visualization, educational science, cognition, and design, with the aim to enhance learning experiences in public spaces and classrooms.


