
For the past six months, my husband and I haven’t gone to sleep at the same time.
We both work full-time and raise two young children, so our evenings are the only moments left for connection. He is the hardest-working person I know—relentless in chasing a dream that has recently taken shape as a tech startup. His quietest, most productive hours begin when the kids sleep. I, on the other hand, go to bed alone.

At first, I texted him, “Good night.” He would reply hours later, sometimes with a simple “coming to bed now.” But after two months, I realised something: I had data. It’s not formal, tidy data- casual timestamps, scattered messages, and a discernible pattern.
So, I started tracking it deliberately. A spreadsheet. One column for the time I went to sleep, one for him. If I forgot to log it, I would ask him in the morning: “When did you come to bed?” He always knew I was tracking his bedtime time. It comforts me. Data gives shape to ambiguity. It holds stories quietly, waiting to be told.

There is a particular calm that comes with collecting data. For me, it is a form of emotional processing. Tracking our sleep was something small I could hold onto. A private system of meaning. Each entry felt like a whisper to myself: “You are paying attention”.
As the dataset grew, so did the emotional tension. We argued. Not because I didn’t support him, but because I missed him. Missed us. One night, I added a third column: fights. Eventually, a pattern emerged. We always argued at the start of the week after the weekend reset. I brought it up, along with the spreadsheet, and together, we coined the Sunday-In-Sync Rule. Once a week, we would meet in the middle. He would wrap up earlier, and I would stay up later—a small act of reconnection in a sea of drift.
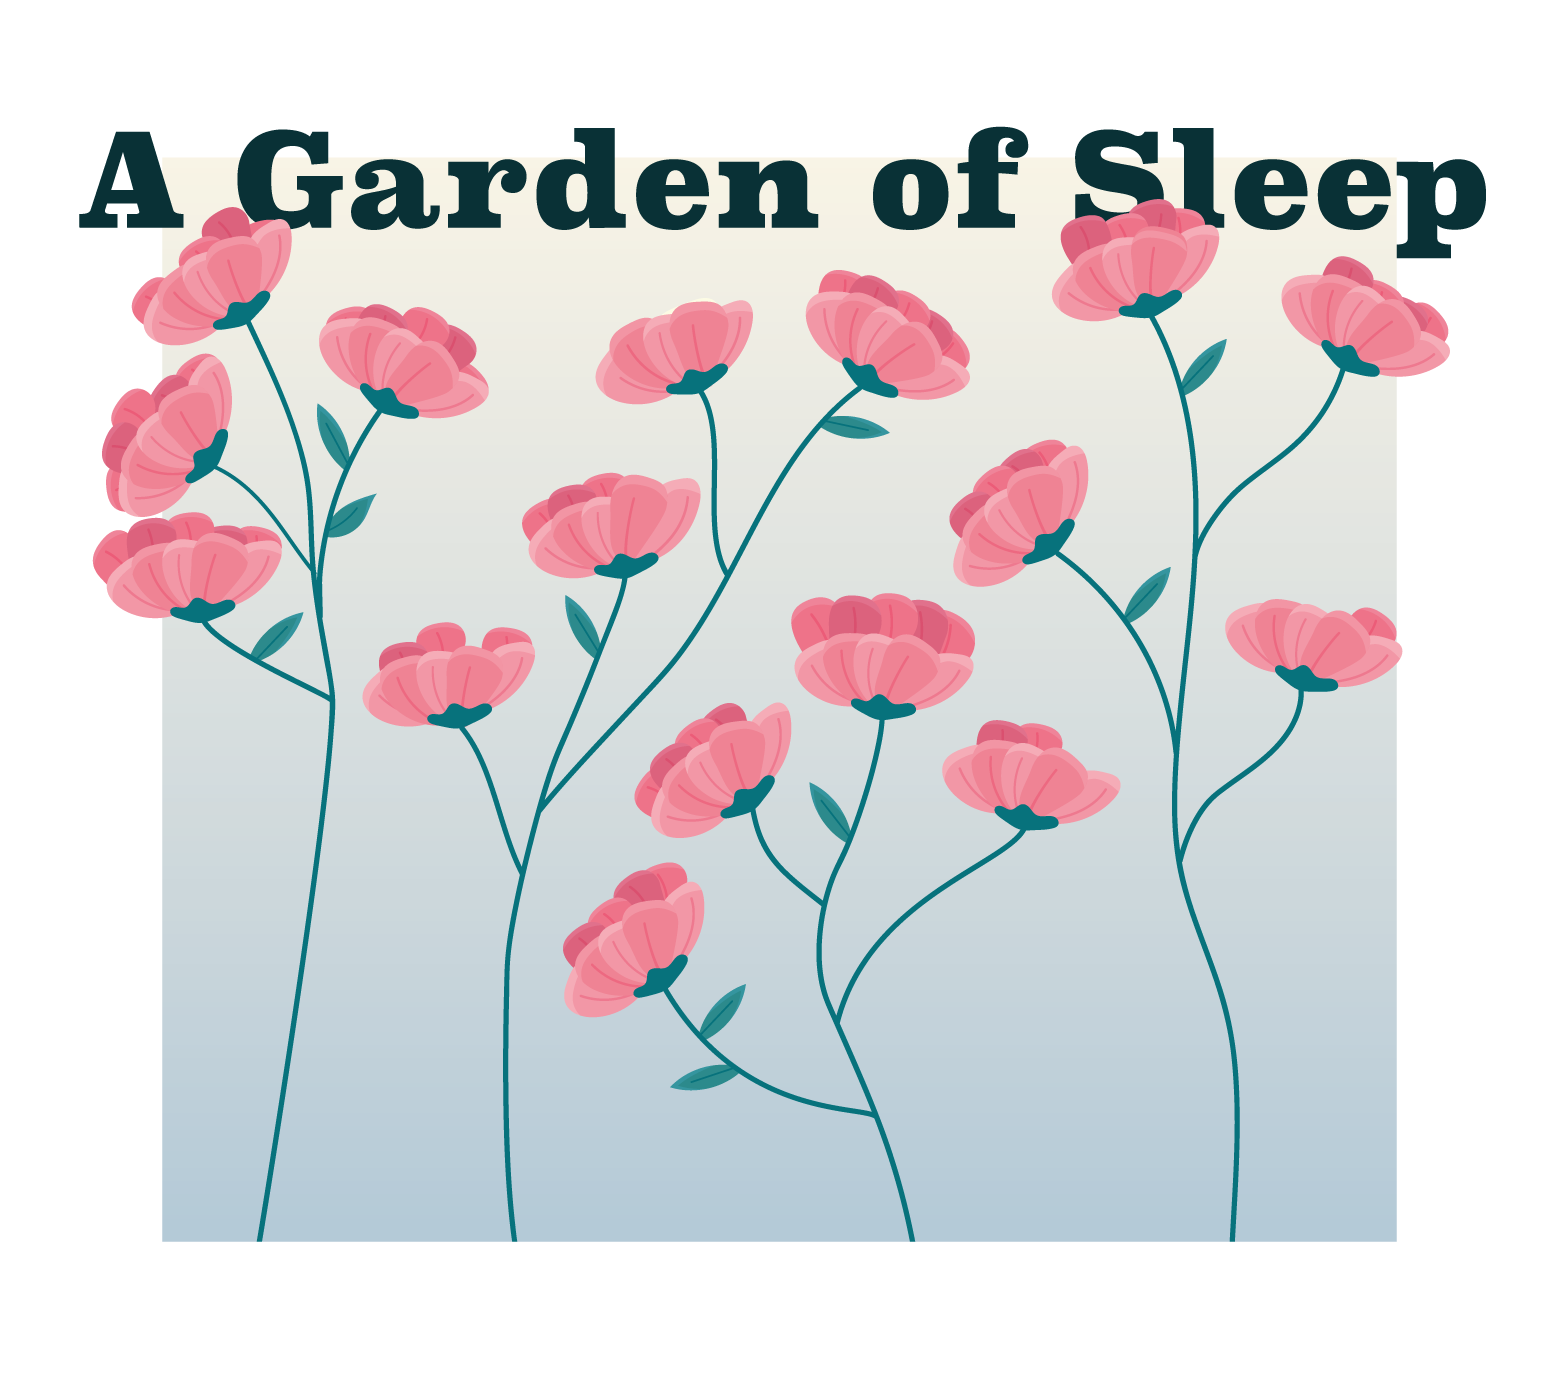
At one point, I realised that the actual times we went to sleep didn’t matter as much as I thought. What mattered was the delta—the difference between them. That delta became the emotional signal, more about how far apart we were. From that moment on, I shifted my perspective on the data and how I wanted to visualise it. Each petal would represent a single day. My sleep time became the baseline. His would be expressed as a distance—the space between us.

Five months in, the dataset had become too complex to keep in rows and columns. I started sketching. One flower for each week. Some flowers bloomed, representing nights spent together, even if late. Some wilted, marking long gaps between bedtimes. A visual garden of our sleep patterns emerged. A bouquet of data is carefully drawn.

Why flowers? Because they are the most classic romantic gesture. A universal symbol of affection, apology, and devotion. I was not just visualising data; I was creating a love letter. One that said, “I see you. I miss you. I’m with you”. Presenting the data as a bouquet felt right. It framed the tension with tenderness.

Drawing it brought another kind of clarity. Unlike the spreadsheet, which was linear and clinical, the floral format made space for nuance and softness. It became a way to honour the emotional weight of these minor, repetitive, daily differences. A quiet ritual that helped me come to terms with what I could not control.

When I showed him the finished visual, he was speechless. Then smiling. Then laughing. He told me I was the most supportive wife he could ask for. Later, I found out he had shared the piece with his friends. That meant everything to me. He saw what I saw.
Is it a visual love letter? A quiet protest? Maybe both.
What I know is this: in tracking our distance, I found a way to feel closer. I supported him in silence, witnessed his effort, and honoured the rhythm of our parallel dreams.

Or is a critical thinker and an enthusiastic data-visualisation designer who finds patterns in everyday life and transforms them into clear, meaningful visual stories. She previously lead the UX & Data Visualisation within the Business Intelligence department at IEC. She just started a practice-based PhD exploring how data visualisation can support more balanced decision-making for people living with diabetes.
- Or Misgav

- Or Misgav

- Or Misgav

- Or Misgav


