
As an avid fan of the Vikings, I was extremely excited about the new spin-off on Netflix titled Vikings: Valhalla. Simultaneously, my network-and-data-scientist self was just as curious about how the original series and the new one, set a century later, will relate to each other. Thus, I decided to build a network map of the realm of the Vikings shows to examine the series in a quantified, objective way, following my previous explorations of the Game of Thrones or The Witcher.
The Vikings’ data
As in any data science project, data collection was one of the first major steps I took. To construct the network of the Vikings’ characters, I needed two things: the list of characters (that will be the network nodes), and information about their relatedness (serving as network links). While using the TV series directly could certainly work well, here I simplified the problem and relied on the Vikings Wiki. In particular, I started with the character-listing subpage shown in Figure 1. This site showcases the full list of characters in a comfortable, well-structured html format that I collected and parsed in Python with urllib and bs4. My scripts can be found in this GitHub repo.

After collecting the full cast of the Vikings, including the name and Vikings Wiki identifier (profile URL ending) of about three hundred characters, I started scraping their individual biographical profiles (corresponding code in the GitHub repo). As the example of the famous and infamous Ragnar Lothbrok shows in Figure 2, these profiles have a whole bunch of hyperlinks pointing to other characters – basically, network links. For instance, Ragnar is linked to his first wife, Lagertha the shield-maiden, his children, Gyda and Bjorn, and even his treacherous brother, Rollo.

Building the network
After having all the biographies in hand, I started building the network. In this network, every character is represented by a node, and they are linked (for the case of simplicity, in an undirected way) if there is at least one reference connecting their profiles, while the strength of their connection is proportional to the number of these references. Following a few simple intermediate steps (see the GitHub repo again) and feeding these references into the NetworkX library, I arrived at a graph with 221 nodes connected by 1,104 edges. While NetworkX and Matplotlib are great and handy to quickly visualize networks directly from the data in an iPython Notebook (see Figure 3 for the raw visualization), it is usually a lot easier to design and fine-tune mode detailed network visualizations with Gephi.

So to obtain a more digestible network visualization, let’s turn to Gephi. Gephi is open-source interactive software that can use graph data in various formats (.gexf, .graphml, .csv, etc.) as input data that one can also easily generate directly from NetworkX in Python. Furthermore, Gephi contains several visualization features like node sizing, coloring and opacity tuning, different implemented network layout algorithms like Force Atlas or Fruchterman-Reingold, and advanced tools for computing different network statistics such as centralities or modularity. The raw network opened in Gephi is shown in Figure 4.

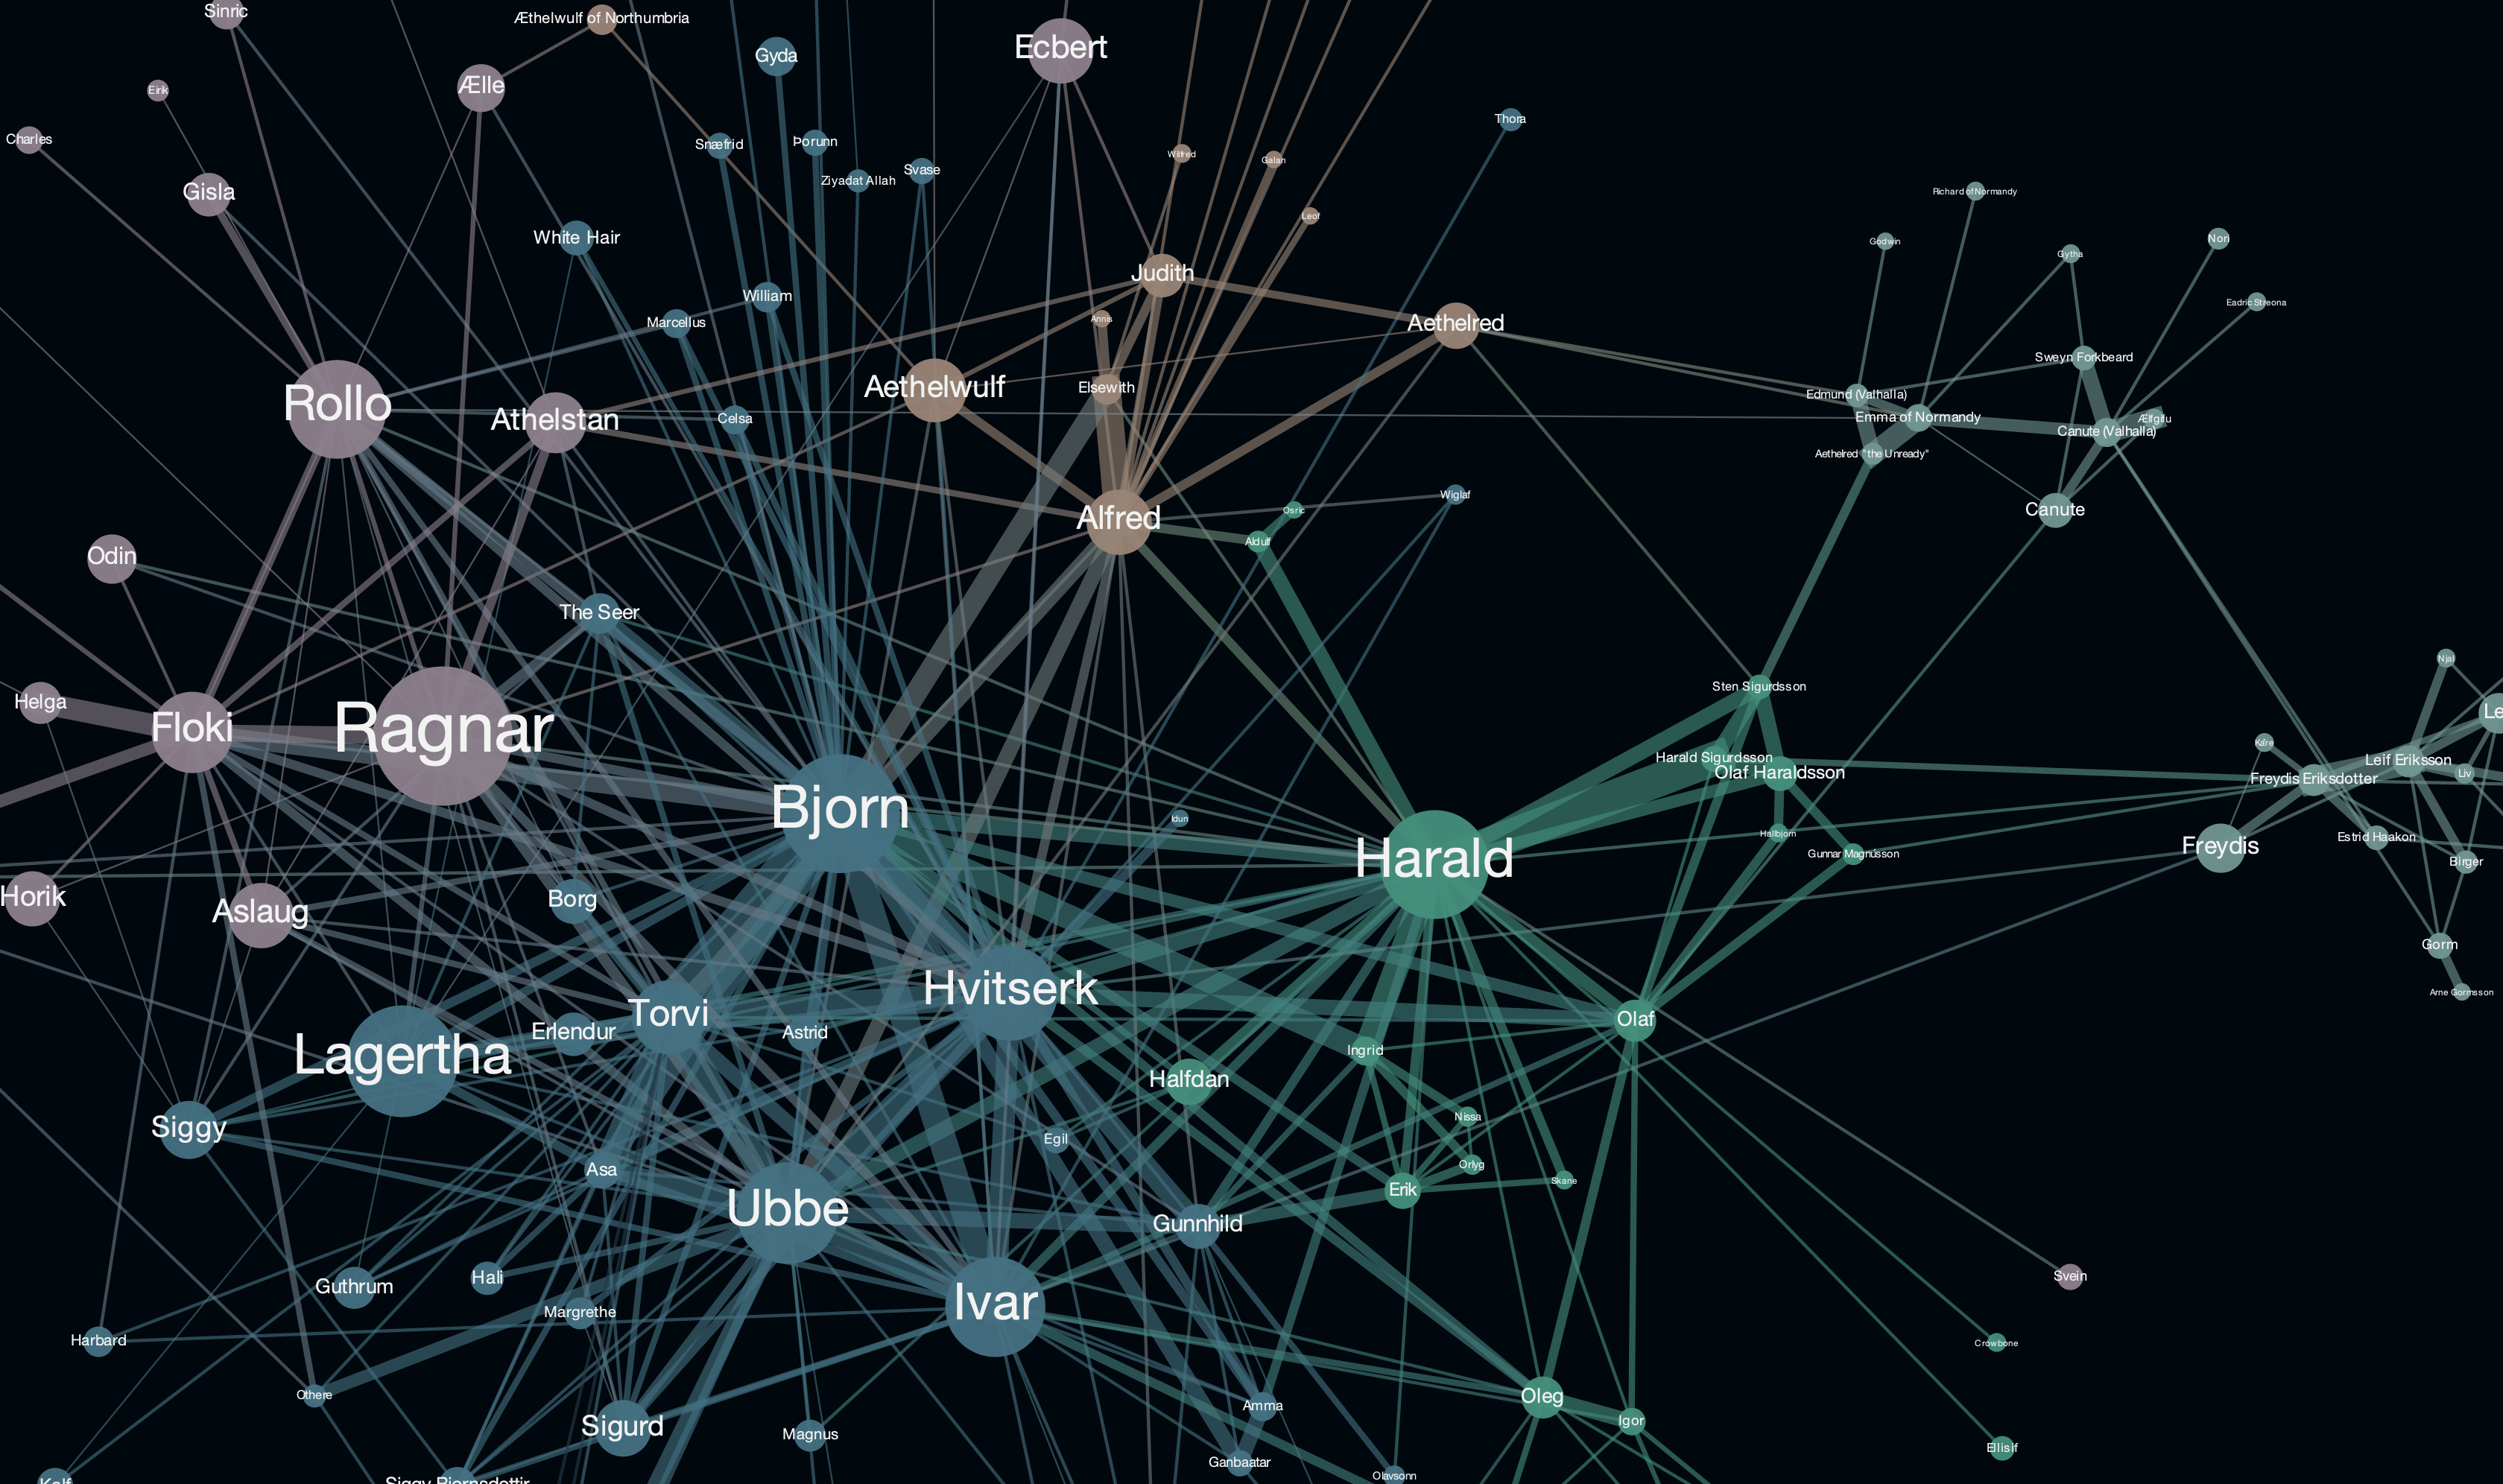
With the raw network file open in Gephi, I started working out the final design, first by setting the node size to be proportional to the node’s degree (number of connections they have) and applying my favorite Force Atlas 2 layout. This layout algorithm places the network nodes on a plane as if gravity-like physical forces were pushing them apart and pulling them together, providing an organic-looking image revealing the network’s core structure. Next, I used a modularity-finding algorithm that clusters nodes together based on connectivity patterns, resulting in clusters of nodes that have much stronger connections towards each other than towards the rest of the network. I colored the nodes according to these network communities. Then, to get a clear network visualization, I filtered out those connections that had a weight lower than two. In other words, I discarded those cross-references between characters that are not signaling frequent interactions. Following these steps, I arrived at Figure 5 showing the backbone network of the Vikings social map with 149 nodes and 399 links.

Reading the network
Let’s understand a few stories the network visualization tells us. First, I checked which characters are the most pronounced hubs — who has the highest number of connections? This simple measure says that the top 10 most connected characters are Ragnar, Bjorn, Lagertha, Harald, Ubbe, Ivar, Rollo, Hvitserk, Floki, and Torvi, in this order. From this list, only two characters are not members of Ragnar’s family: Floki, who despite not being blood-related, probably still counts as family, and Harald, who connects the old Vikings series to Valhalla.
Diving further into the network’s degree distribution, it turns out that Ragnar has 85 connections, followed by Bjorn’s 71 links, and to make the family whole again , Lagertha ranks third with 66 edges. Additionally, almost 30 percent of the links connect to at least one of the top 10 characters, while 160 characters have less than 10, and 48 characters have less than three connections. A zoomed-in version of Figure 5 with these hubs is shown in Figure 6.

When looking at the strengths of the connections, the strongest one turns out to be between the (second) most famous Viking couple — Bjorn and Torvi. They are followed by the link of Harald Finehair and his great-grandson Harald Sigurdsson, directly connecting the original Vikings series to Vikings: Valhalla. The ten strongest links are typically dominated by Ragnar’s sons (central blue cluster), and surprisingly, a Valhalla-connection in the top as well. This link connects the two main characters of Valhalla, who are also siblings, Freydis Eriksdotter and Leif Eriksson. Interestingly, the strength of Ragnar’s strongest link is just about 35 percent of the link between Bjorn and Torvi, implying that Ragnar’s connectivity patterns were rather oriented towards diversification than the strength of relationships, which seems logical to a true explorer.
Finally, it is also worth taking a look at the network communities, which are subgraphs of the network within which it is more likely for two nodes to be connected than having links outside of the community. Extracting network communities is a widely researched area, thus I simply relied on a widely accepted tool. As Figures 5 and 6 illustrate the communities via coloring, one can quickly read how the early seasons centered by the two brothers, Ragnar and Rollo are on the left, while the main body of the episodes starred by Ragnar’s sons is in the middle. On the left side of the figures, it’s also noticeable how the new series builds up its clusters, being connected with the strongest link to the original series via the bridge of the Haralds. Additionally, it is also visible that there are English scenes on the upper part of the network — showing connections between the original and the spin-off shows once again.
Concluding remarks
To wrap up, in this short piece I illustrate how we can build the character network of the TV show Vikings using their fan wiki site and simple tricks in Python. Additionally, I show the different steps of visualizing, reading, and interpreting this network.
Of course, as with most projects at this scale, it leaves many questions open and many directions for further improvements, such as more accurate character-mention (and name-) matching, differentiation between the types of mentions (e.g., bio text, family relations), and the quantification of connections based on the mentioning texts’ sentiment.
Finally, the corresponding Python source code and Gephi files are available in this GitHub repository: https://github.com/milanjanosov/VikingsNetwork.

With a background in physics and biophysics, I earned my PhD in network and data science in 2020. I studied and researched at the Eötvös Loránd University and the Central European University in Budapest, at the Barabási Lab in Boston, and the Bell Labs in Cambridge. I am currently the chief data scientist of Datapolis, a research affiliate at the Central European University, a senior data scientist at Maven7, and a data science expert of the European Commission.
- Milán Janosov

- Milán Janosov

- Milán Janosov

- Milán Janosov


