
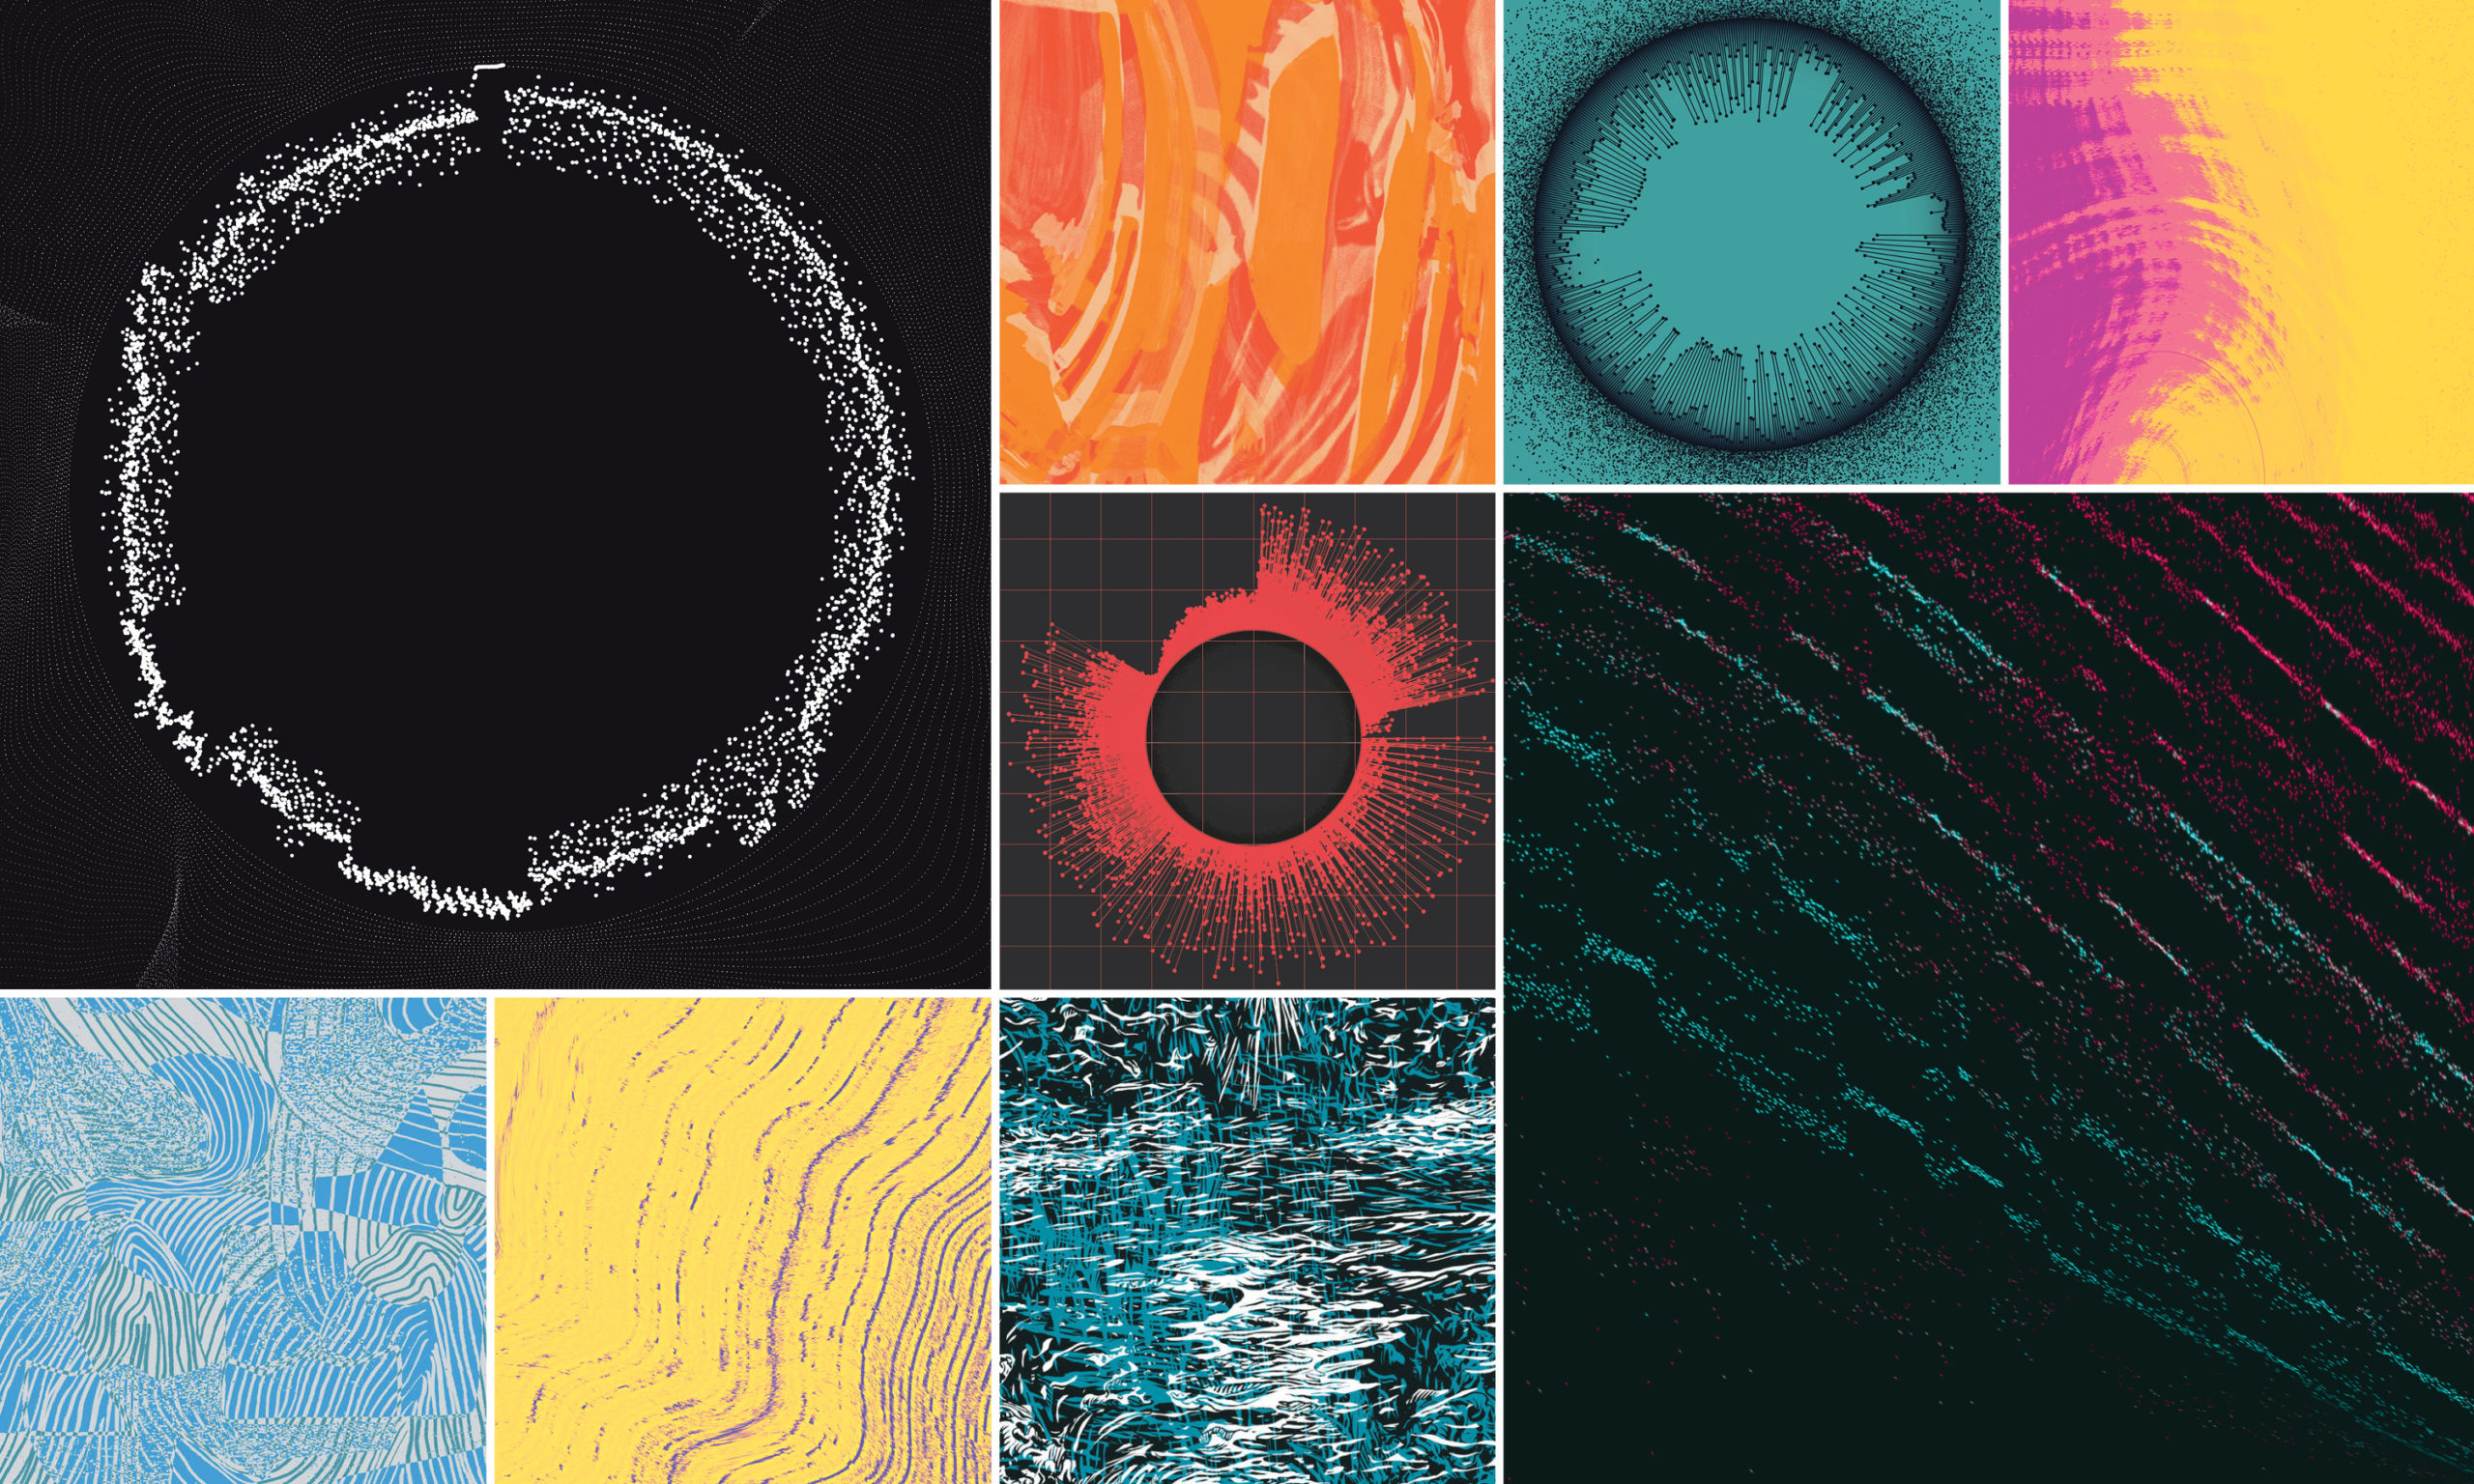
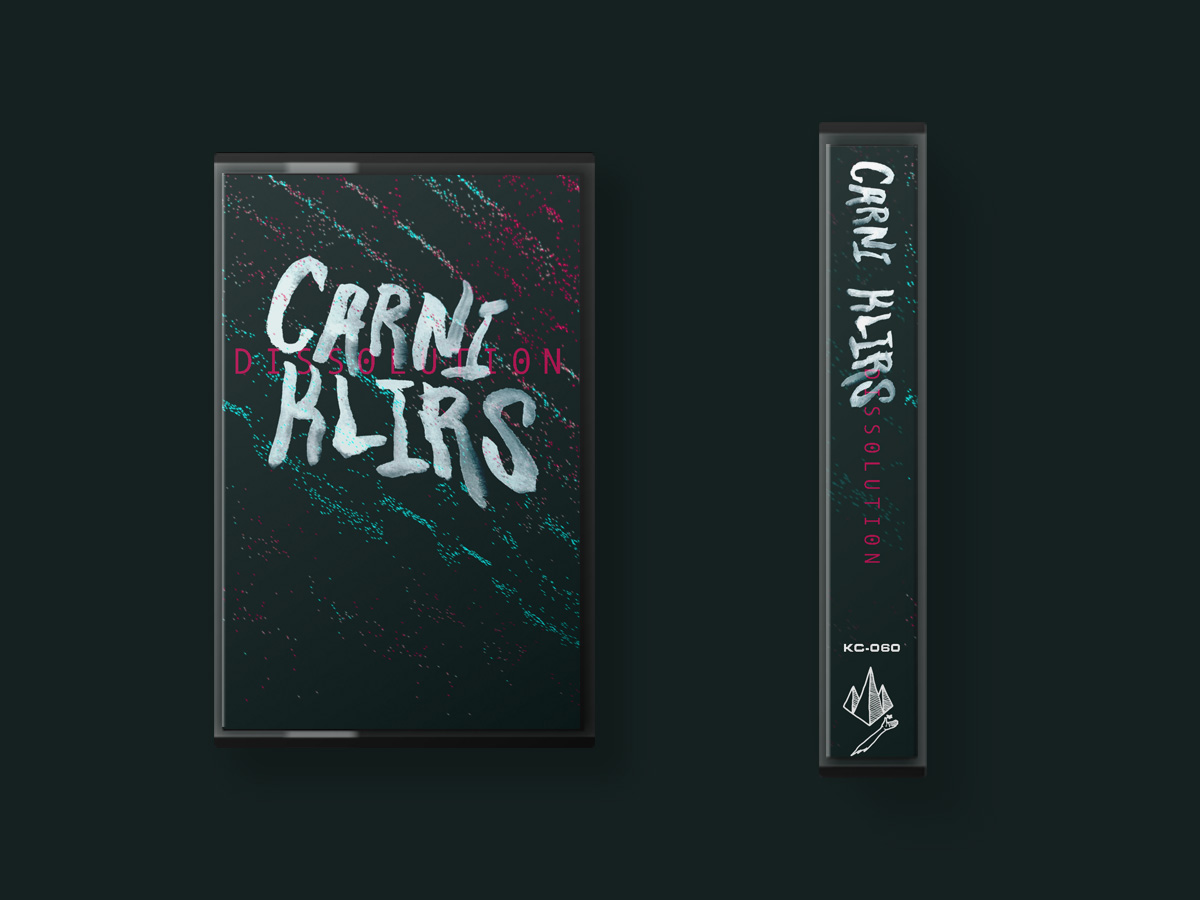
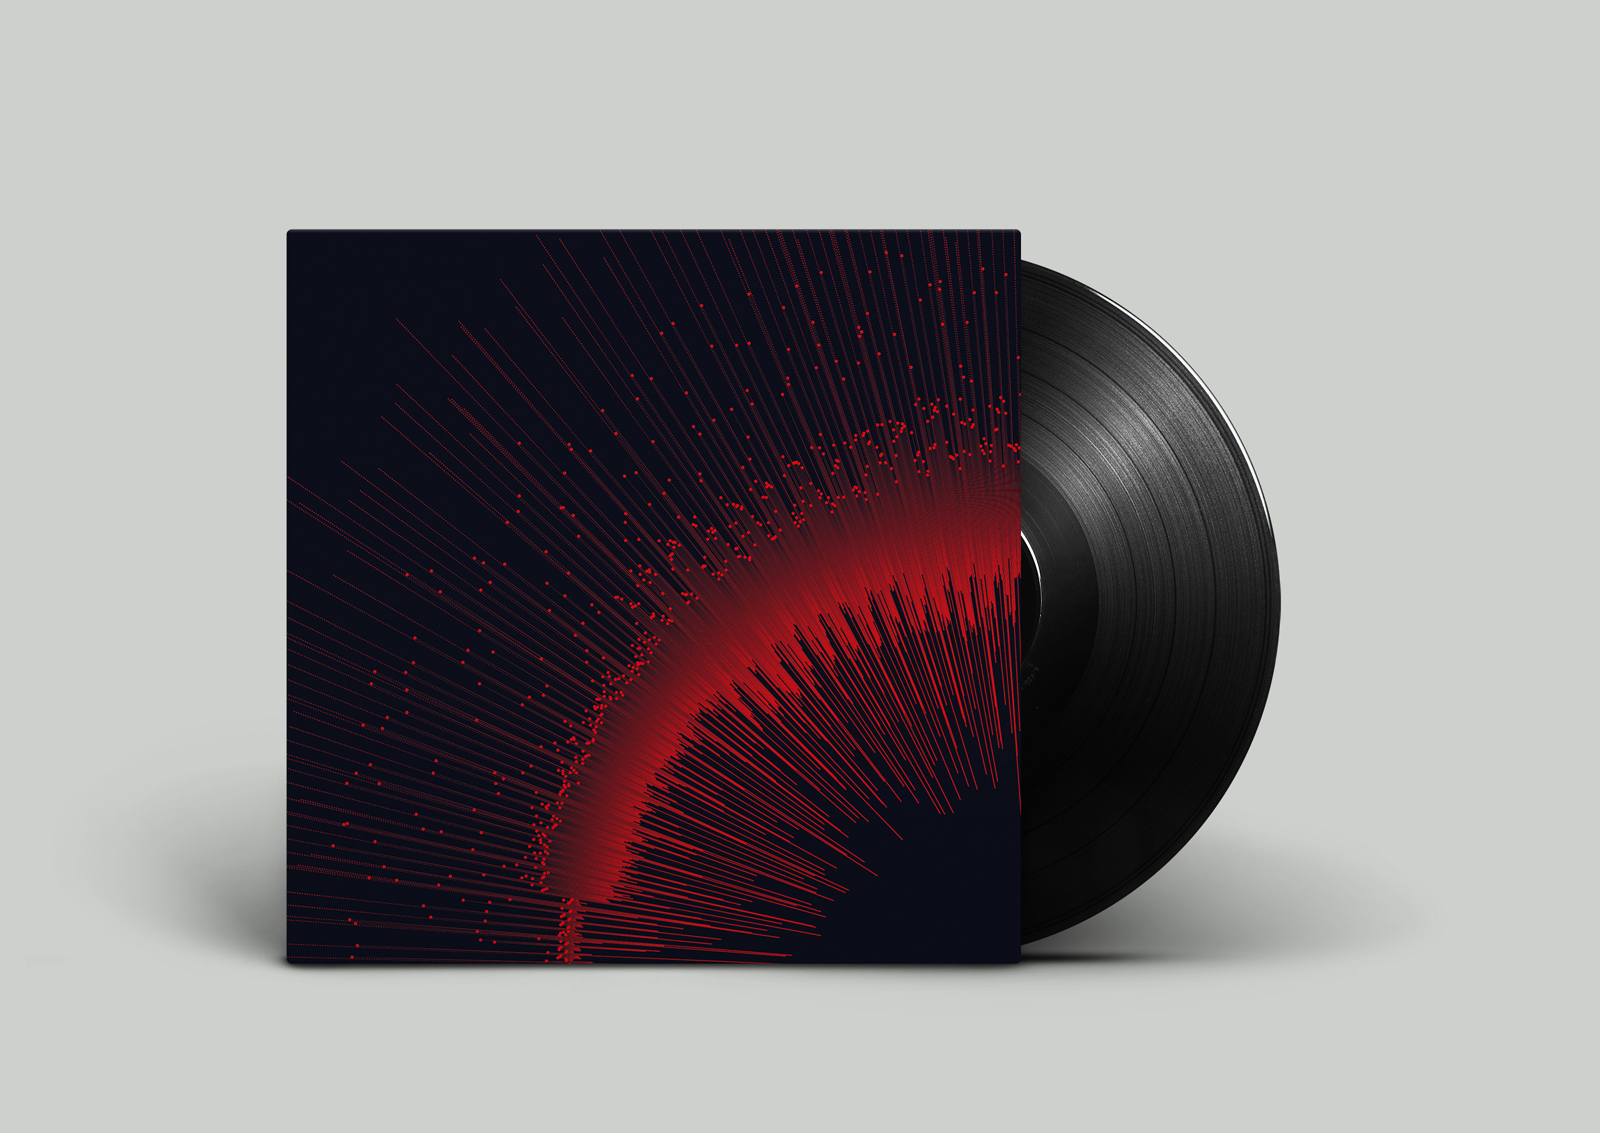
While there have been several great album covers that feature Data Visualization (Joy Division’s Unknown Pleasures is based on a scientific diagram of Pulsars and Kate Bush’s Aerial features the waveform of a blackbird’s call), I have not encountered many examples of album covers that visualize the music itself. After recently creating a set of data-driven artwork for my album Dissolution, I’ve been thinking about this lately. I wanted to have a conversation with other folks who have created album artwork with data, or are thinking in a deep way about the connection between music and visuals.
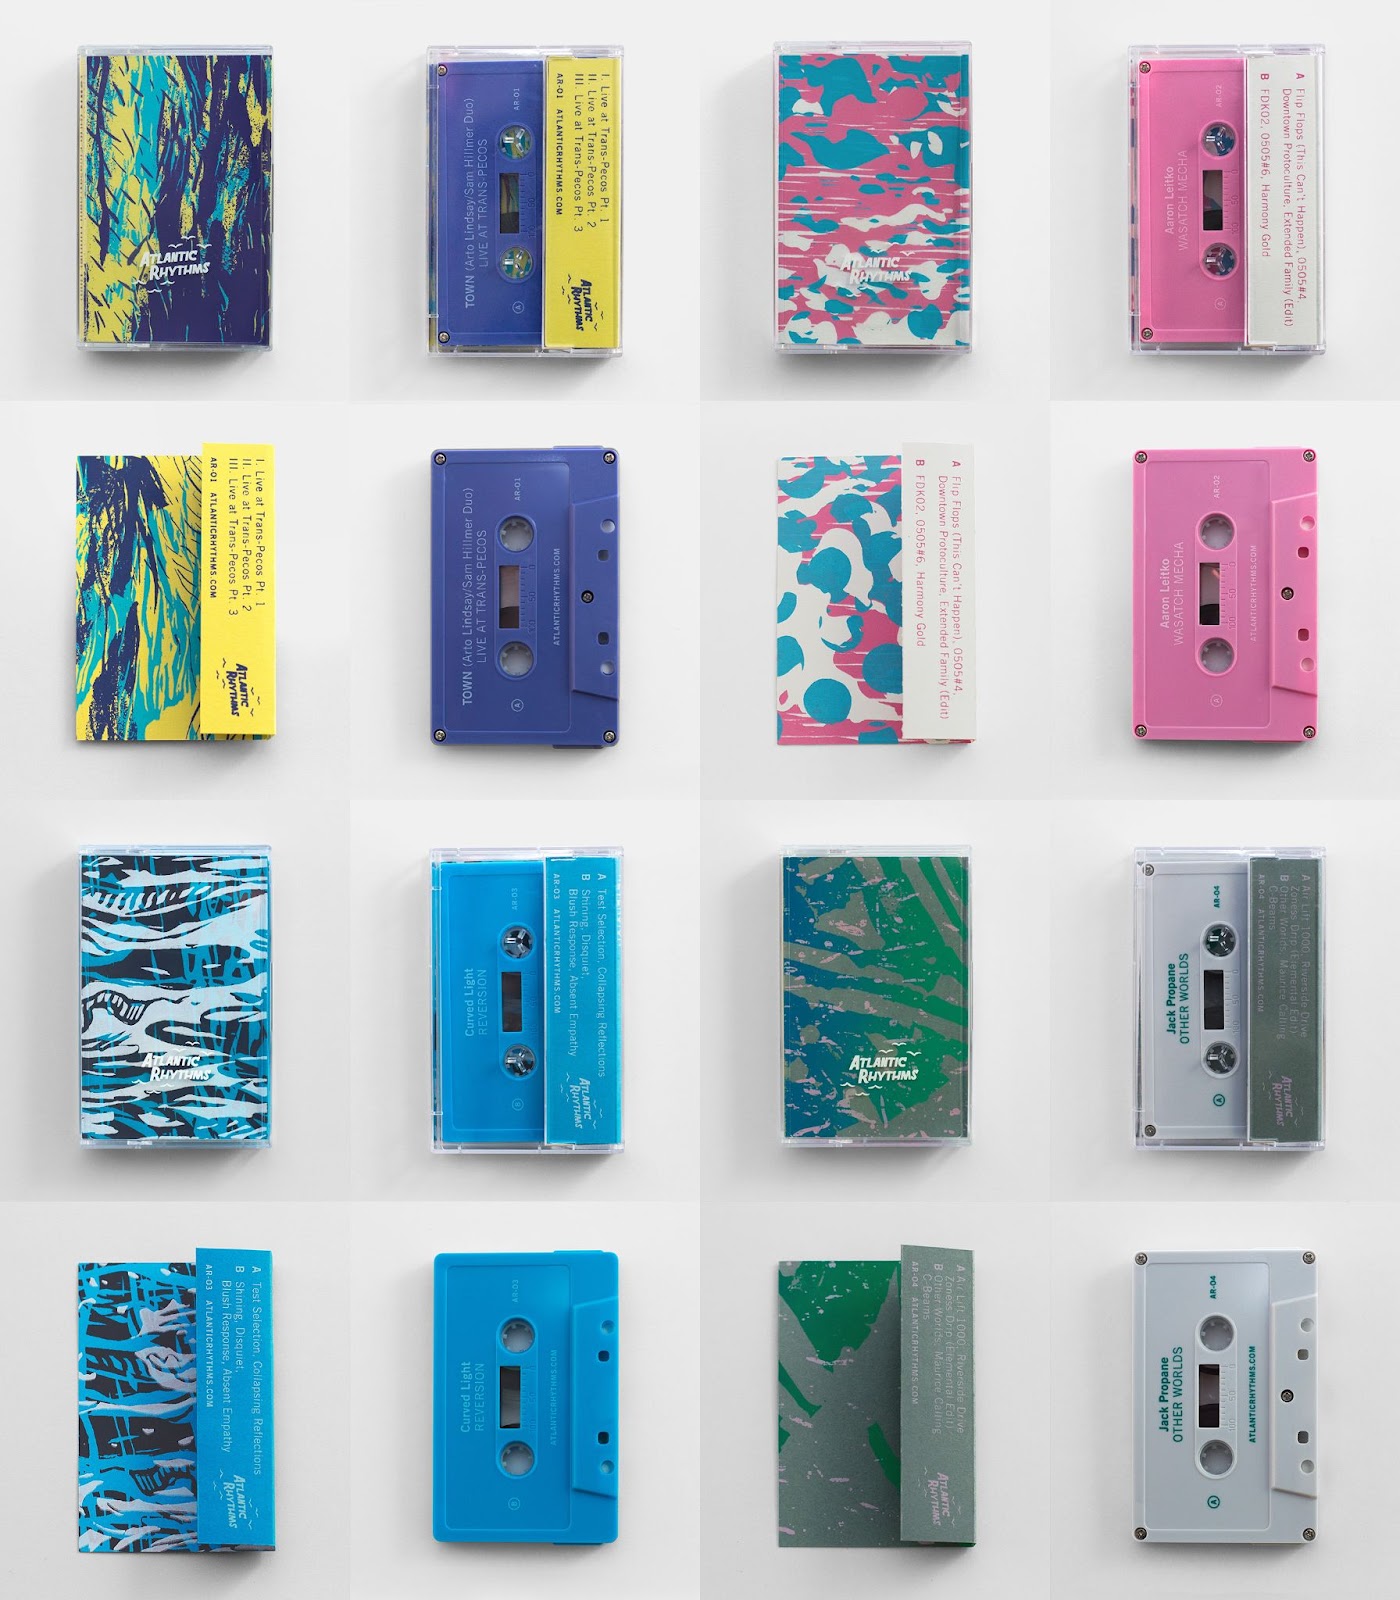
I talked with Tiziana Alocci, a freelance information designer who has created a number of data-driven album covers, and Sean Peoples, who runs Atlantic Rhythms records, a label with a consistent approach to creating abstract artwork for album covers. What follows is a lightly-edited conversation between the three of us.
Introductions
Carni Klirs: Hi Sean and Tiziana, thanks so much for taking the time to talk with me. How about we start with introductions.
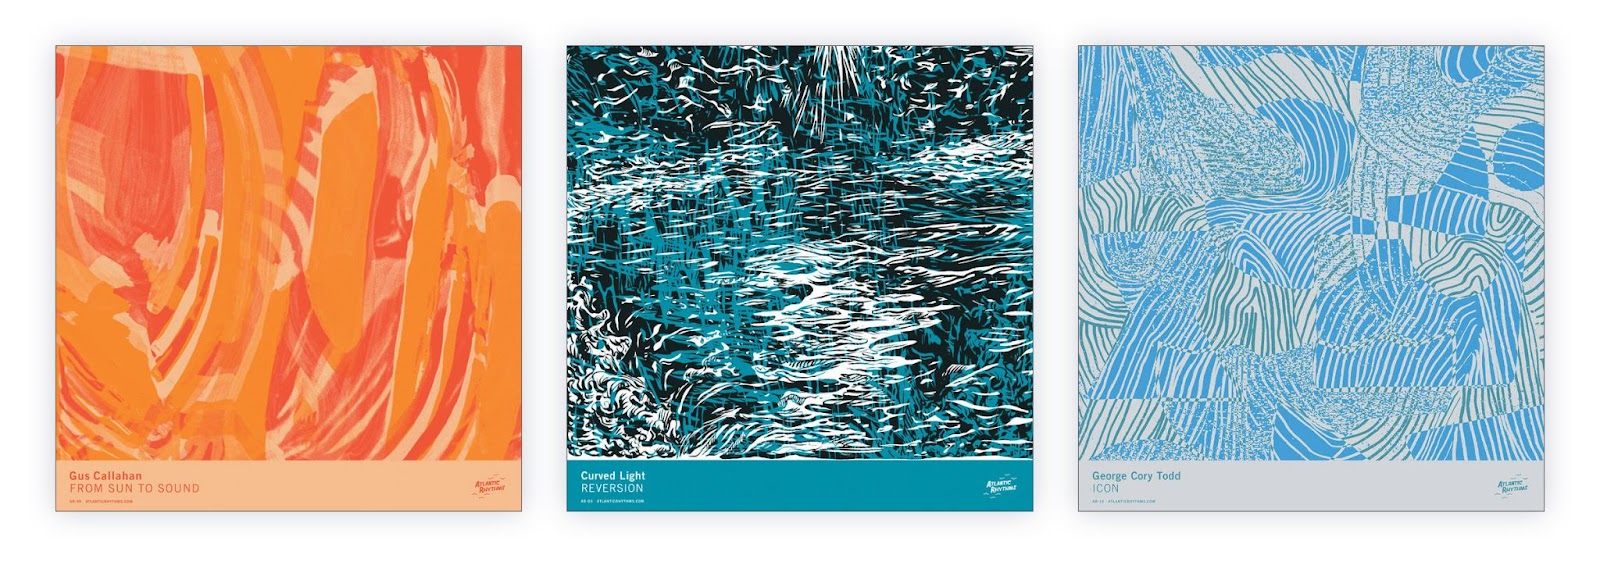
Sean Peoples: I have been running the label Atlantic Rhythms for the last six years. Before that, I ran a label called Sockets Records. Both of those record labels sprang out of a desire to document an amazing artistic community around me, in DC with Sockets, and then maybe a little wider with Atlantic Rhythms. I’m also a filmmaker — music got me into filmmaking and especially into film editing. So, in some ways, everyday is filled with music, which is my childhood dream. I get to work with so many people in the design space, and collaborate and curate that, which is one of my favorite parts of running a record label, besides the music.
Tiziana Alocci: I’m a freelance information designer based in London. I’ve been doing this work for almost 10 years now, and I’m also an associate lecturer at the University of Arts London at the London College of Communication. Several years ago I opened my own studio where I now work as an independent designer, solely specializing in data visualization for every kind of platform. Around two years ago, I began this collaboration with Sum Over Histories, an independent music label based in Berlin, Germany, and we started to do this experimentation with music and data visualization.
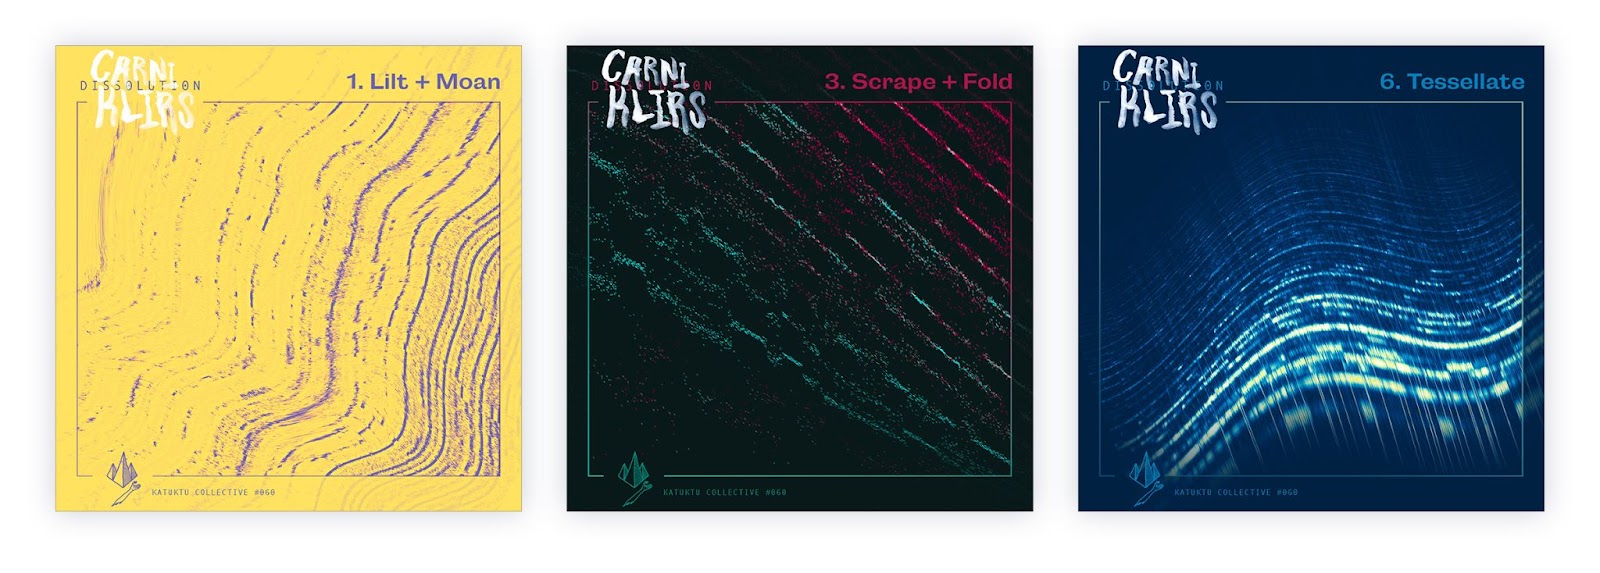
Carni: And I’m Carni, a Washington, DC-based musician and information designer working at Graphicacy. I got my start as a designer in high school, making flyers for punk shows using photocopiers. Years later, I’ve come full circle, and recently applied some of my skills with data visualization design to create artwork for an album of my solo album, creating unique track art by using visualizations of the frequency spectrum for each song.
Extracting data from sound
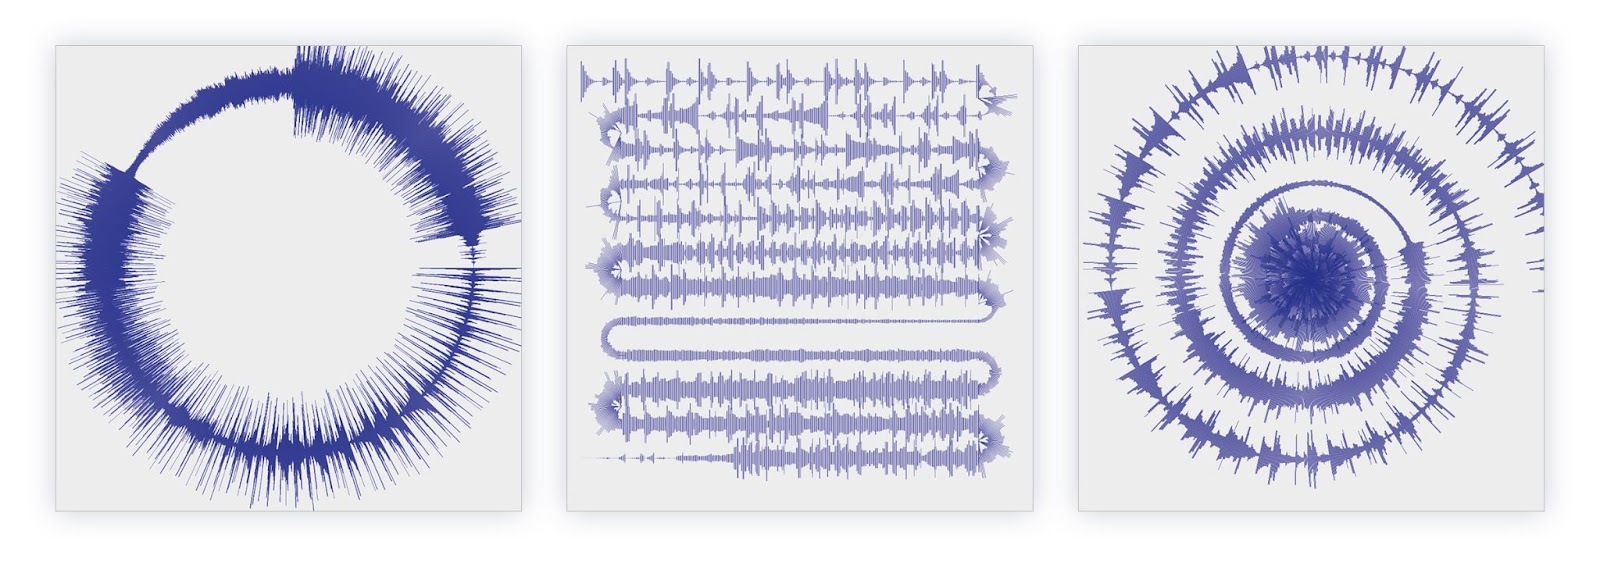
Carni: I want to dig into tools and data. Tiziana, I believe you are visualizing the waveforms of the tracks. (Waveforms are a display of the amplitude, the volume of a track, on the Y axis, and time along the X axis.) I would love to hear how you extract data out of the waveforms, and if you are getting actual data points out of the waveform or just working with the shape of it.
Tiziana: While I do usually visualize the waveform of the song, it’s always different. It’s like the fingerprint of each song. So even if I use the same type of structure, let’s say I’m going to use the waveform for three albums in a row, all these waveforms are going to be different, because all the songs are different, and all the emotions and the feelings that arise from the song are different, too.
The actual process of using the data is a very, very fast thing. And I like to keep it that way, because again it’s a little bit of an escape exercise from the usual work that I do. I mainly use a software called Sonic Visualizer. That allows me to load the waveform in vector (SVG) format, and from there, I can play with it using other software like Adobe Illustrator. Sometimes I play with some scripts and a couple of lines of code to convert the song into numbers. While I have no idea what calculation the script is using, it returns something that is measurable, that I can use. It’s not the most strict or rigorous process. Data visualization practitioners are going to be horrified and say, “Oh, my God! This is not a 100 percent accurate representation of the data,” but that’s not the goal in this case. Instead, I use data to see what type of visual I can create that links to the emotions of the songs.
Carni: I’m totally with you, that 100 percent accurate representation of data is not the point. In terms of my own work, my own attempts to visualize music and create album artwork, so much of what you said feels similar to my approach. The big difference is, rather than just focusing on the waveform, the amplitude, I look at an additional dimension of the sonic characteristics of a track. I’m using a tool called a spectral analyzer, or a spectrogram, which splits the sound apart into the full frequency spectrum that’s audible to the human ear (typically 20hz to 20,000hz). The Y axis is Frequency (the lower end corresponds to the low notes, the bass content of the music, and the high end is the treble frequencies, the shimmer on guitars and the cymbals), and the X axis is time. Volume or Amplitude is shown as color, so a color gradient is applied to show density of sound at certain frequencies.
A spectrogram is really an analytical tool. If you take a look at a spectral image produced by someone playing a violin, you can see the harmonic series created by the note being played. The root note and all it’s overtones gives each instrument its distinctive timbre. What gets interesting is when you do a spectral analysis for an entire track when all the instruments mush together. For the kind of music I make—which involves building a wall of sound, this ambient mass of sound of many different instruments layered together—when you run that through a spectral analyzer, it produces an image with a lot of texture and character.
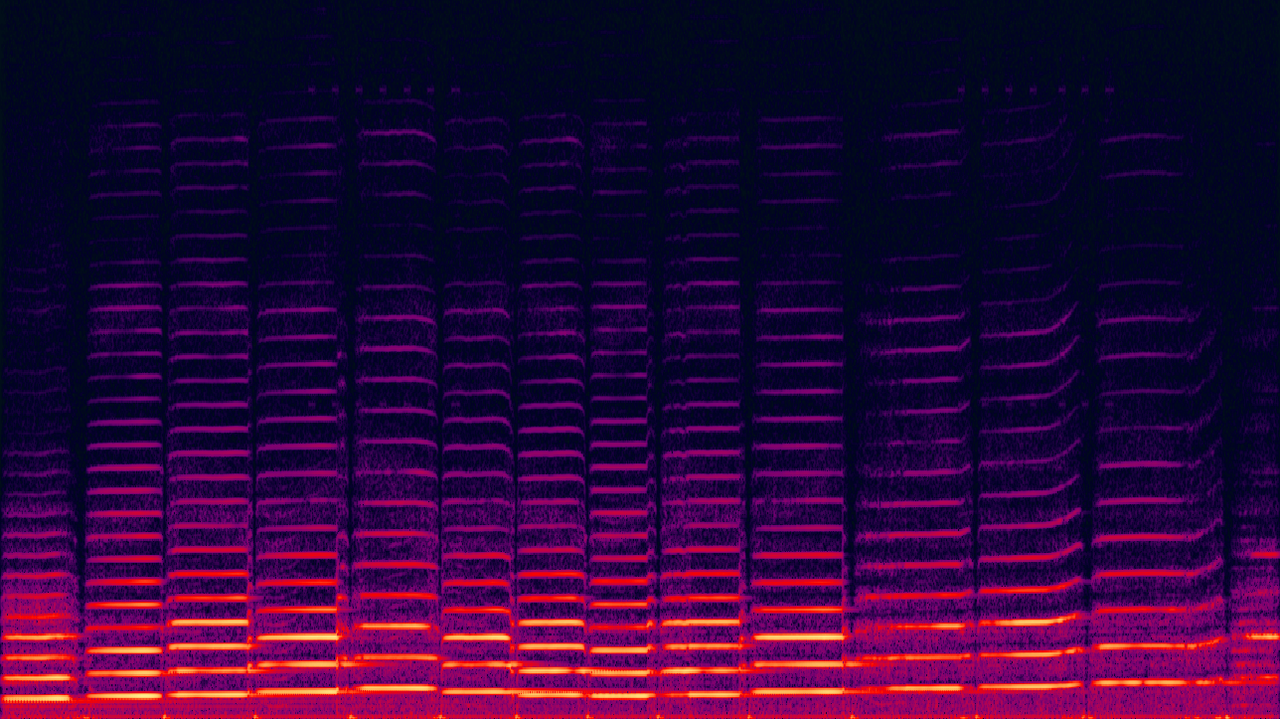
From there, it’s a similar process of play, experimentation, iteration, pulling, and pushing to manipulate the image into patterns that start to match the mood of the music. One more channel of experimentation I have is zooming in to certain sections of the track, so you can start to see the “grain” of the image. You can even zoom into a fraction of a second of music, and this creates a digital, “chunky” image, as you can see each individual “grain” of a digitized slice of sound. Or you can zoom out to the whole track, and get hyper-detailed, organic forms that look like ocean waves or topographic maps.
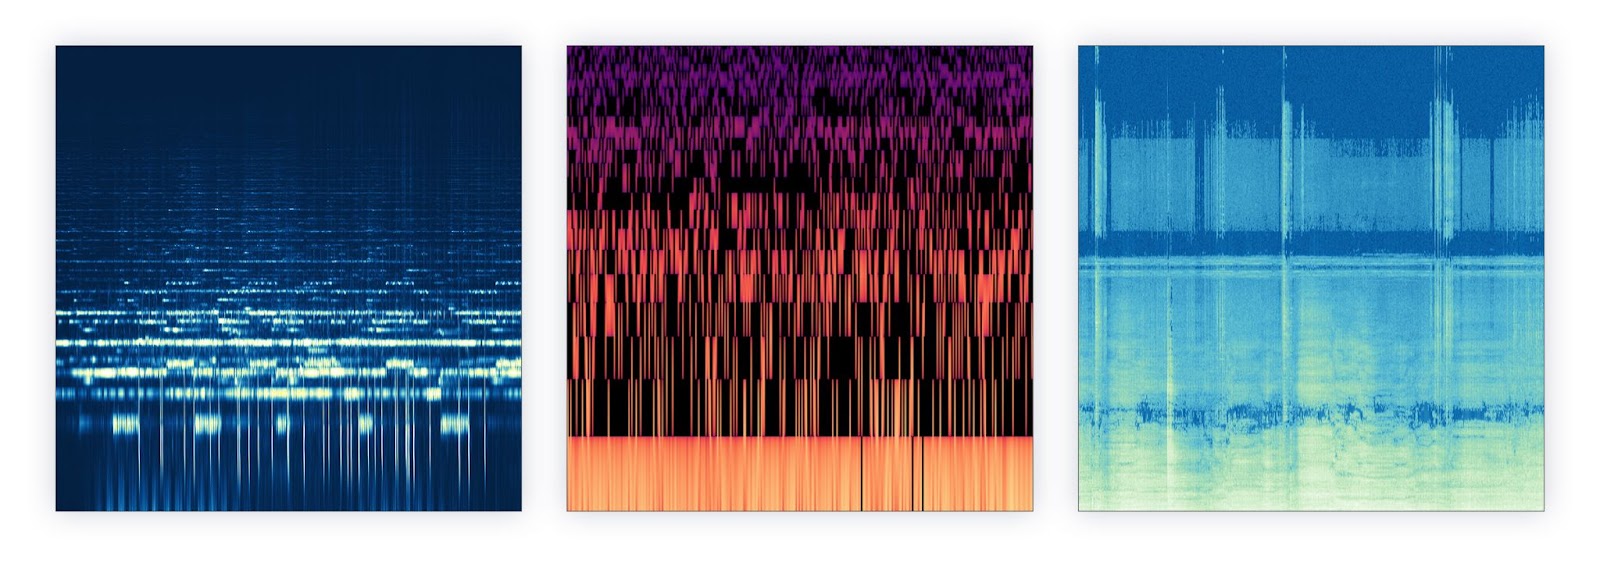
That is the raw material. From there I continue to experiment in design software, and apply color. So in the creation of the visuals, there’s a lot of happy accidents. Which is similar to the way the music itself was made, with a lot of glitching and bending of the sound. The way I’m actually playing the notes with my guitar, I bend notes, and once recorded, I continue to bend and glitch the notes digitally. So I felt like that was an appropriate way to play with the artwork as well.
This process worked for me for my own music, and I felt like I was able to directly translate what I do musically into something visually. I have no idea what it’d be like if I tried to do this for another artist. But I think our processes that start from a place of intuition, a place of thinking about the feeling of music, is the same for both of us.
Turning data into album art
Carni: Why choose data visualization for an album cover? Why visualize the sonic characteristics of the music? Tiziana, why did the label Sum Over Histories reach out to you in the first place?
Tiziana: I visualize data every day. Most of the work I do is corporate. So, every time that I get the opportunity to work with material which offers more creative freedom, I immediately jump into that. I started this collaboration and I guess the Sum Over Histories founders were interested in the compositions of the works that I usually do, which are intricate and complicated data visualizations. So when they asked me to do some artwork for these records, my initial idea was to start to visualize some of the songs, some of the tracks.
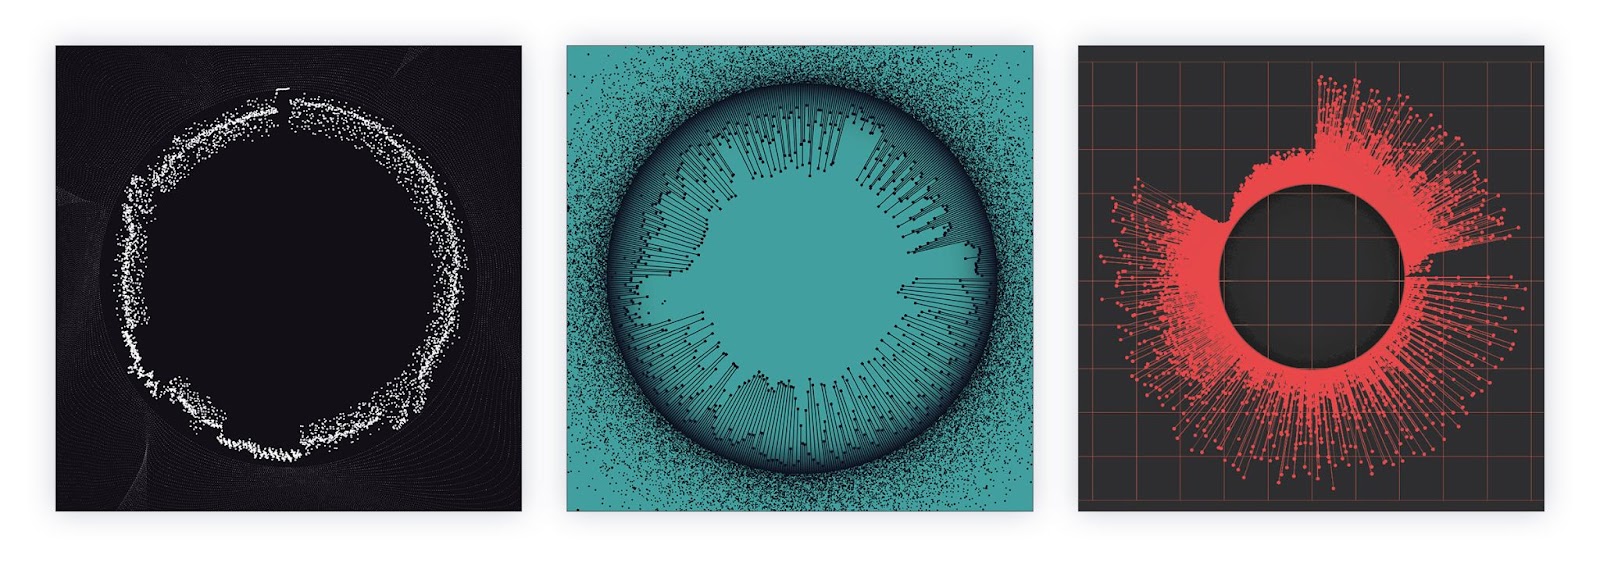
I approach this type of work in a different way compared to my other clients, and I use data as creative material. This is something that is sometimes done with generative art and creative coding. I have a huge interest in music and this label produced techno music. It was an opportunity to tap into an industry that I love and in which I’ve never worked before. What I tried to do is to combine my personal style with the emotions and feelings coming from the songs—from the atmospheres that the songs and the artists evoke with the tracks. I created these artworks which are data driven, but also have a component of mystery and a halo of the unknown. There are no keys, no numbers, no typography, nothing, only the subject is present. It’s wide open to any type of interpretation from the listeners.
Carni: I love the idea of keeping a sense of mystery in the artwork. One of the reasons I wanted to talk to you two specifically, is because of your work bridging that gap between raw data and drawing inspiration from the music itself. Data visualizers, once they have their hands on the raw data, have all the tools at their disposal to work with it. The part that is hard to describe is the intuitive process of extracting the mood and the feeling of the music and representing those visually. When done well, when you make a strong connection between the visual and sound, it feels cohesive and can add so much to the listener’s experience. While it may be a losing proposition to try to systemize that into something that other people can replicate, because it’s such a personal or idiosyncratic process, depending on who’s doing that work, we can at least share how each of us approaches it. Sean, while the album covers for Atlantic Rhythms aren’t data-driven per se, we can still learn from them as works of pure abstraction that are so evocative. Can you share a bit about your process for creating album artwork for Atlantic Rhythms?
Sean: I work with one designer, Nick Apice, and we talked about the kind of the design system that we would employ for Atlantic Rhythms for almost two years. It was a very, very long, intentional conversation. Building on what Tiziana said, it was based out of a desire to create something with mystery, something with emotion. We also had a real desire to make the process for creating the visual patterns as collaborative as possible. Every time we set up a release, we have our artists give us a list of five images, and a set of two or three color patterns. That, along with the music itself, starts the process, which always involves serendipity.
We match a pattern and a set of colors to music. The only thing we’re missing is the data.There is, however, a more organic form of data collection that includes listening to that music and creating a pattern that is reflective of a certain emotion or sense of mystery. Color plays such an important part in how those things interact, when those patterns come together. Some real magic sometimes emerges in those collaborations, between myself, the designer, and the musicians. We want to have that musical experience be more than the sum of its parts, so if you’re looking at the art while you’re listening to the music, then you’re interacting with it as a complete package. The visuals can create new pathways for people to unlock when they listen.
Matching the mood with color, shape, and texture
Carni: Are there certain colors or shapes or textures that tend to more strongly evoke certain moods, or even certain genres? What else informs the creative process?
Sean: I love that question because I think about it a lot, and for a period of my life maybe obsessed about it. But I don’t know the answer to it. However, I put out music that makes me feel something, and I trust in this collaborative process between designer and artists. When I look at the end of the process, I’ll usually say, “Oh, wow! This does make sense that this music kind of feels like this pattern.” But there are no hard and fast rules that say that this pattern or this shape makes me feel a certain way. I do think we’re playful with iteration, which can yield good results. Sometimes you’ll take one image and you’ll try to combine it with another it doesn’t work, but if you change the color of it, it completely works and so there’s a lot of just testing. I think you have to come to that process with an openness to let those moments emerge.
Tiziana: Just to follow up what Sean said about process, which I think is key for any design practitioner, I do have my own specific process. Data visualization is a serious, complex job, as you sometimes visualize data about casualties or deaths or maybe financial data, or any other type of information that is quantifiable. I do have a process and it’s really not negotiable. When working with music data, I follow the same steps, staying just a little bit looser. These works are my personal take on data art.
When I start a new album artwork, I have this nice routine when they send me the songs and I listen to them on headphones. Maybe I go out for a run or for a walk or while eating or doing different activities, so I can see which songs inspire me the most, or maybe evoke a particular emotion. Some songs are really dark. Some are really happy and fast. Some may be closer to a particular season, for example, some may feel a little bit more wintery.
I like to play with the color also to balance that kind of emotion that the songs draws up. From there, it’s a really conceptual, mindful way of designing. I just let the data inform the shape, and then try to act like an orchestra director. I try to keep everything in place, but with a certain level of freedom.
I really like to use circles and rounded shapes in every type of data visualization that I do. Oftentimes, that’s not possible in my corporate work because there are a series of constraints in terms of accessibility, readability, and the platform you use. A circle is a complicated shape to use for standard data visualization, where you have to add labels, numbers, titles, etc. Album cover art was a good opportunity to just do what I like to do. But now, I find myself a little bit locked into this circular shape, so I’m trying to move out from it, toward something different. I like to leave it a little bit loose and let the music inspire me.
Sean: That moment between–you’re going out for a run, you’re listening to the track to find inspiration. And then you’re in that space and then starting to manipulate the data to try to get the design, I find that really fascinating. I mean, how much input do you have versus how much you’re relying on the software or the data? How much of you is in that process, how much are you kind of pushing and pulling the data to make the visual? There’s a lot of mystery to me between the inspiration phase and then working with data to come up with some sort of design. I imagine you have a lot of control in that interplay.
Tiziana: Yeah, it’s a really mystic phase, which I really cannot describe, because it’s maybe just a moment when I’m inspired by something that I see very quickly around the room or while I’m out. So it’s a very weird and odd moment.
Sean: Music, right? I mean you’re starting from the music and not some other design point. Which I think is amazing. I think that’s really the beauty of this all is it starts with getting inspired by the music.
Tiziana: Yeah, always, always music has a huge evocative power. That’s the type of emotion that I try to trigger when transposing sound into something visual. Definitely, there is a personal interpretation—a series of personal design decisions—but everything is supported by data. That is how my brain is wired. I could never do a piece of art made completely abstractly. I need to have structure. I need to have numbers and analytical and numerical information to begin making a visual structure. And once I have the structure, the skeleton, I can apply all my design thinking and design ideas and creativity, but I really needed to have a backbone first.
Abstraction vs. figurative art for album covers
Carni: One thing all our work has in common is Abstraction. I want to look back to the origins of Abstract Art in the mid 20th century. There was a period of time when artists were no longer interested in the figurative, they were no longer interested in depicting the real world. They were interested in a pure world of visual form, and trying to evoke feelings from the viewer with the formal elements of color, line, texture, and shape. Perhaps we’re all borrowing from that approach in the work that we’re doing, consciously or unconsciously. Why is abstraction such fertile ground for album artwork?
Sean: In some ways it invites the listener in on terms that aren’t so prescribed. It creates a collaboration between the artists and the listener. By creating a cohesive package of visual and music, you’re giving the listener tools to guide them on a journey. Abstraction opens more room on the listener’s side for interpretation.
Tiziana: Yeah, I agree. Anyone can see anything inside the same song. On a spectrum of visual representation where we have reality on one side and abstraction on the other, music lends itself to abstraction. A song that makes me really sad could be a wedding song for someone else. I try to keep the design as abstract as possible so many people can recognize themselves in it. People have told me “this looks like a supernova explosion,” or “this looks like a black hole” or like a flower or even, “This looks like a mouth sending a kiss.” I like this idea of leaving the artwork abstract so as many people as possible can see something in them.
After talking with Tiziana and Sean, I remain convinced that visualizing the music itself is a rich and under-utilized method of generating album artwork. Whether working from a place of pure intuition and abstraction, like Sean and designer Nick, or working with raw data of the sound waves themselves like Tiziana, it’s a method of art making that can create surprising and magical results.
While all three of us use different tools, techniques, and approaches, we had the same difficulty trying to quantify the unquantifiable: why do some colors, patterns or shapes match up perfectly with a certain piece of music, and how did we know when we landed on that perfect pairing of music and visual? Perhaps it’s not something that can be reduced to a recipe, a tutorial. Maybe some things are best left a mystery.

Carni Klirs is a Washington, DC based designer and musician. He is the Lead Data Visualization Designer & Associate Creative Director at Graphicacy, where he creates interactive, data-driven applications for mission-driven organizations.


