
This article originally appeared in Issue 2 of Nightingale Magazine.
In Nightingale Magazine Issue 1, we launched the Dear Nightingale analogue data creation challenge with Giorgia Lupi and Stefanie Posavec, a play on their Dear Data project. (Check out the challenge submissions here.) But rather than repeating the same challenge in each issue, we’re branching out! Dear Nightingale will be hosted by a new data artist in each issue. The Issue 2 challenge is brought to you by Alli Torban.

Step 1: Gather your physical inspiration
Look around your desk or walk around your home, and collect three physical items. Try picking an item that’s always in plain view but you don’t notice anymore. Then grab an item that has an interesting texture. Lastly, pick an item that you were surprised to find. The more eclectic the collection, the better!
Step 2: Line them up and note their attributes
Lay your chosen items side-by-side to create your own physical inspiration train. Pick up each one and write down three of its attributes. How would you describe it? What are its features? What’s the texture like? What does it smell like? How is it used? How does it make you feel? What does it make you wonder? Think beyond what you see!
Step 3: Quantify their attributes
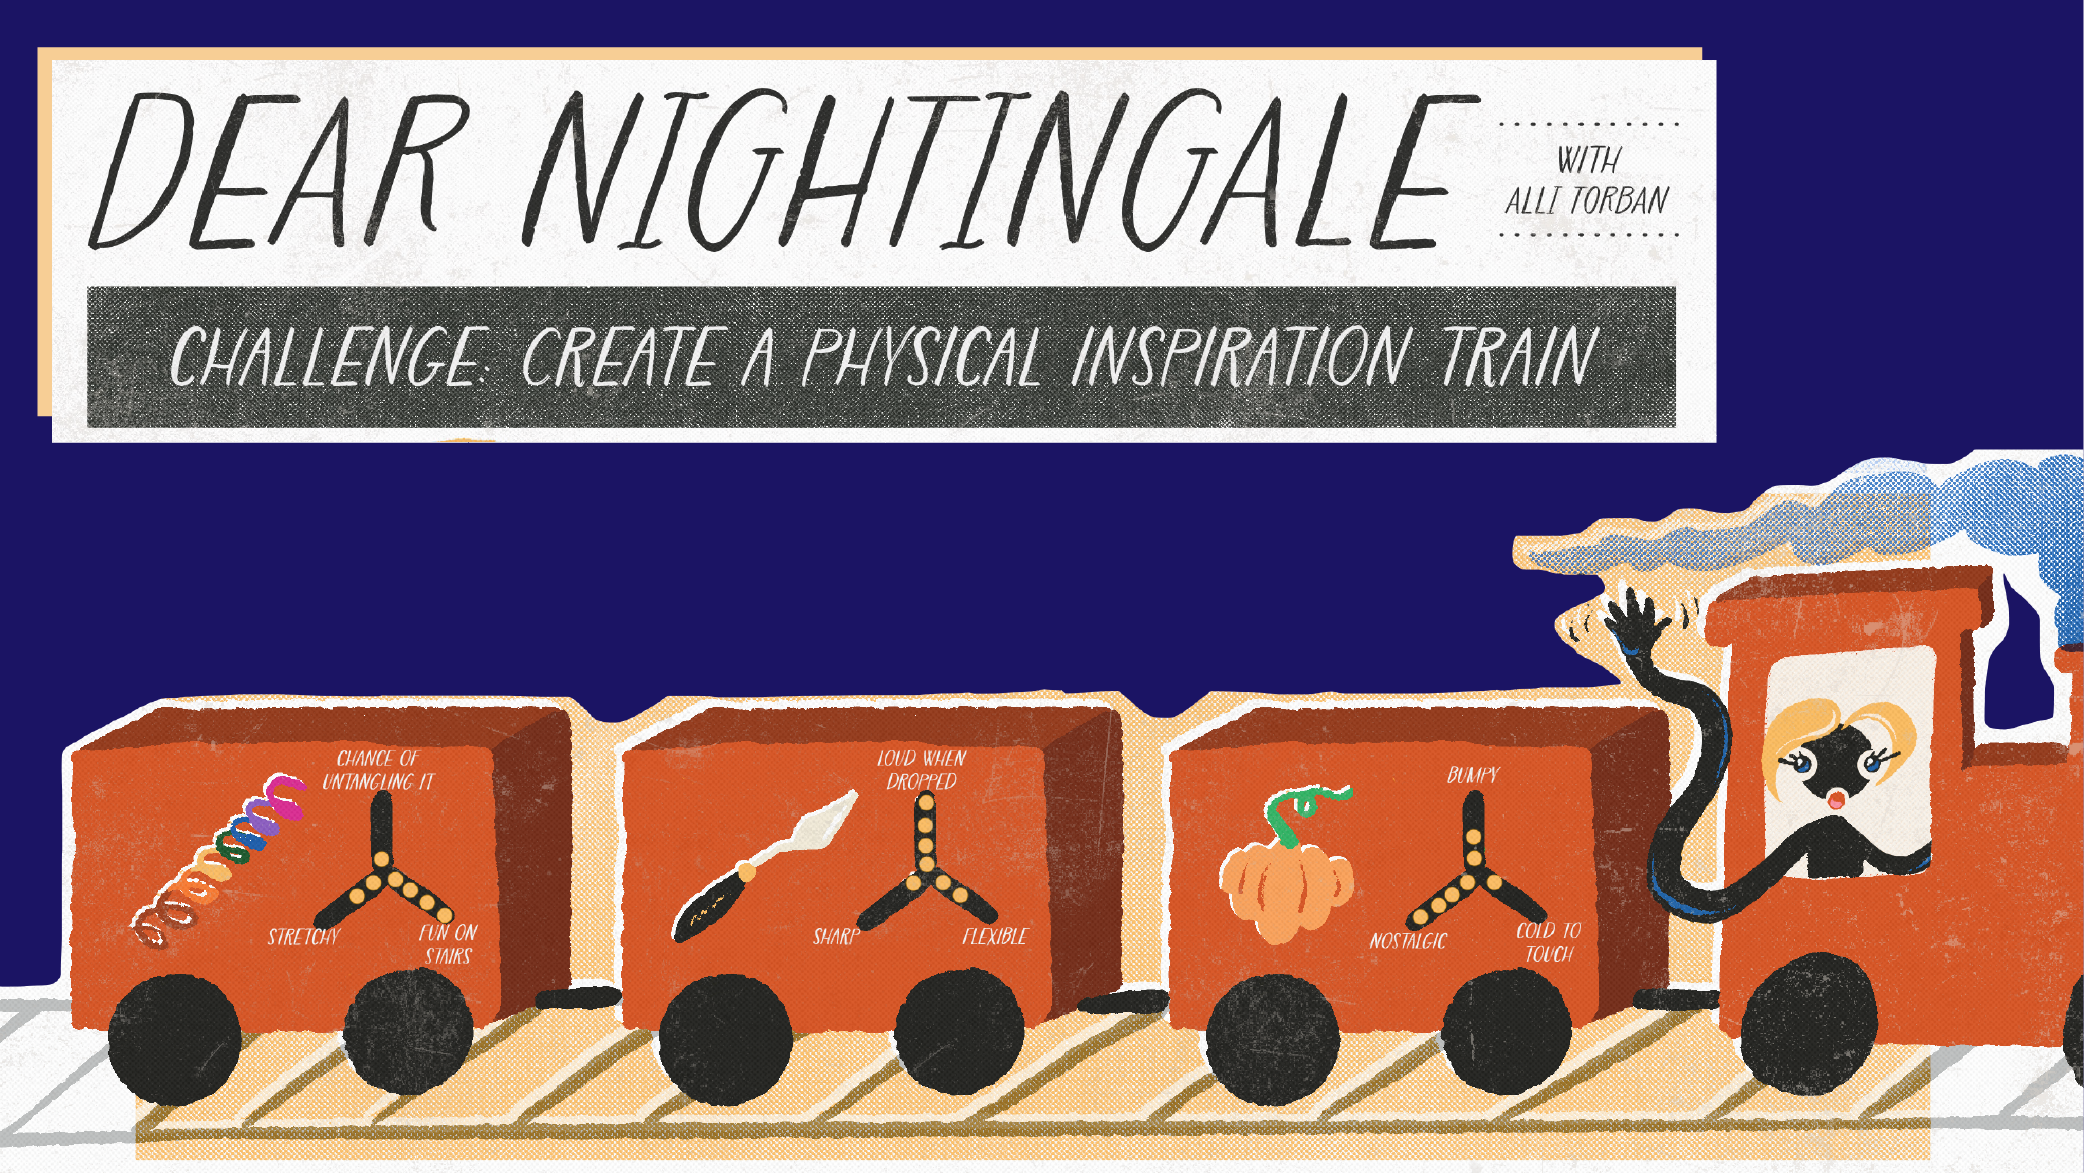
For each attribute, assign it a value. How much does your item exhibit each attribute? A lot or a little? For example, my pumpkin is bumpy. How bumpy? About medium! Maybe a 2 out of 4 on the bumpiness scale. Write down the value that you assign for each attribute.
Step 4: Create little radar charts that describe each item
Now sketch a simple three-axis radar chart that represents the three attributes that you identified for each item. Add your value rating for each attribute.
By visualizing the features of the physical items around you, you’ll begin to think about the complexity of everything in your environment. You’ll begin to recognize attributes that you hadn’t noticed before, which you could bring into your dataviz work (like using a visual metaphor). It also gives you a sense of how data is actually collected — full of decisions, opinions, and bias.
Now let’s see your Physical Inspiration Train!
Send one high-resolution image of your physical objects lined up with their attribute radar charts, plus 150 words describing your inspiration train, to nightingale@datavisualizationsociety.org before FEBRUARY 15, 2023 to be featured online or in print!
Alli Torban is an Information Design Consultant in Washington, D.C., and host of the podcast Data Viz Today.
- Alli Torban

- Alli Torban


