
By the end of the second year of my Master’s program, my love for data journalism, crochet, and football resulted in an unusual project. I crocheted 16 figures of footballers, one look at which will give an idea of how the Russian Premier League (RPL) club spent the 2022/23 season.

How to understand it?
Imagine a table with various data of all RPL teams. Each indicator characterizes the club and its performance over the season (number of points, goals, dry matches, cards and so on).
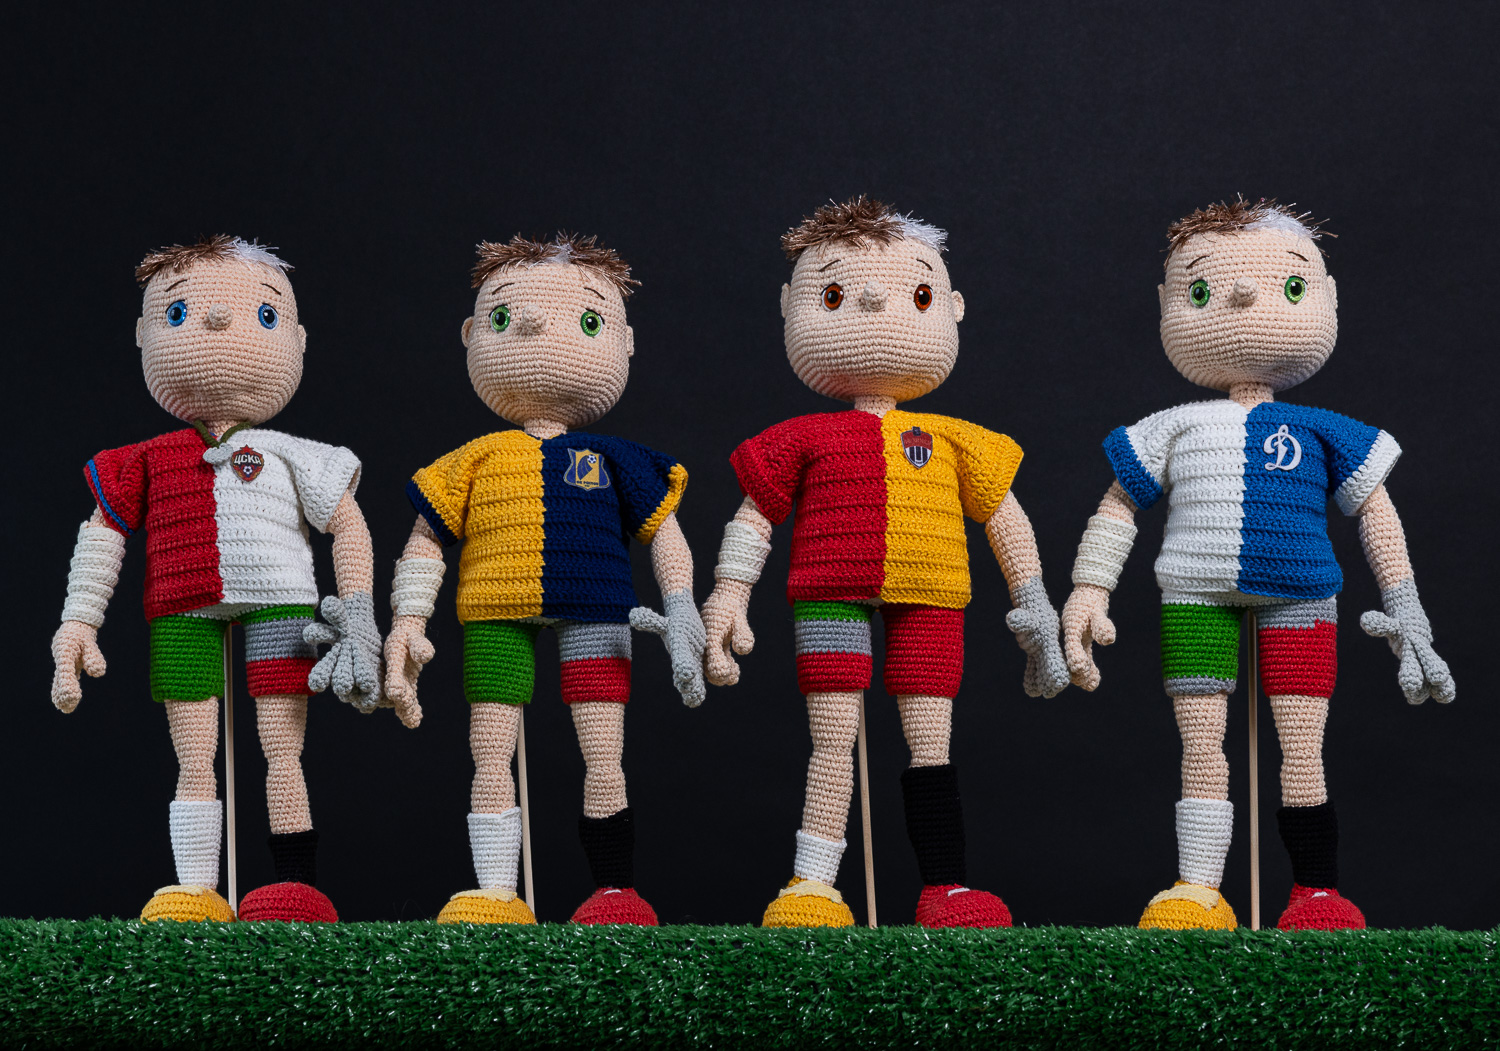
Now imagine a crocheted footballer doll dressed in the team’s uniform.
Combining the two, you create a unique object that clearly shows the statistical metrics of the club. I designed sketches and then crocheted 16 of these footballers. Each of them can be interpreted using a legend or decoding scheme.


And the choice of colour and shape of the metrics is not random. It is based on the audience’s cultural code and association with the data. For example, a goal—a leg—a gaiter, a dry match—a goalkeeper’s glove.
Specific coding methods were selected for each figure and indicator, such as by rows, objects, or chains. For instance, one finger of the glove equals one match, and one loop of the shoelace equals the corresponding number of cards.

Special attention was also paid to legends, because each footballer is a dashboard that requires clarification. For this purpose, a card from the football simulation game FIFA was used and modernized. The familiar image fitted perfectly into the concept.

This is how we got an object of data-art, where every detail not just has a meaning, but carries information that was saved up for almost a whole calendar year.
Time and money
From conception to completion of the installation took more than a year. The active crochet phase amounted to six months of almost uninterrupted work.


In total, about 17,000 roubles (USD$190) were spent on materials for the items and stands, as well as photography. It’s for about 40 pieces of yarn and many other things.
The hardest part, except crocheting, was to encode all the data in the right way. I mean, the data should stay correct and every doll’s piece should look normal at the same time. So it wasn’t easy to make it all together, especially with shorts and gaiters. But in the end was found the best way for each part and metric.
I explained more about the basis of the choice of colors and shapes in the longread. In the meantime, I am preparing for the defense of my work and presentation of the project to the commission at my university. Wish me luck in the comments and share your thoughts about my players!
Supervised and photographed by Tina Berezhnaya


I live in Moscow, where I have just finished my Master's degree as a Data Journalist and now work as a Data Analyst. I love data, crochet and football, so I try to combine all these things in data art. This is how my pieces are made. I've been interested in it for about a year and I'm not going to stop. Only more inspiration and data art!
- Anna Ivashechkina


