
The Soviet Union used data to inspire, terrify, and persuade the proletariat
The story of the Soviet Union is indelibly wedded to its propaganda. Visually stunning and surprisingly direct, Soviet propaganda not only communicated to the Russian people, but it also came to define them as well. Information designers, artists, and communications officers designed images that inspired (or terrified) the Soviet people to commit to action.
As the totalitarian rule of the Communist party spread across the country, the Communists explained their ideas via successive campaigns of visually dazzling propaganda, often in the form of posters. While many of these designs have been studied, the Soviets also employed data visualizations that remain less well known.

These data-rich posters are fascinating artifacts of design and Russian history. But in order to understand them, it’s important to step back and quickly explore the Revolution of 1917, Russian collectivization, and a group of avant-garde artists called the Constructivists.
As the 20th century began, Russia was divided into three groups: the czars, who held a monopoly on political power, the intelligentsia, a group of highly educated citizens who were completely shut out of the government, and the peasants. This last group was almost completely rural, made up roughly 80% of the entire population, and had increasingly refused to acknowledge the rule of law or principle of private property.

To radically understate it, the Revolution of 1917 changed all that. A fraction of the intelligentsia known as the Bolsheviks overthrew and killed Czar Nicholas II and his family. The leader of the Bolsheviks, Vladimir Lenin, outflanked all political opponents and forced the country into complete Communist rule. The message of Communism, however, still had to be sold to the general populace.
Before the 1917 revolution, the Constructivists were loosely affiliated with other modernist art movements in Western Europe. They sought to develop a new visual language based on reducing decoration and streamlining shape and type in order to “construct” art. But after the revolution, they found themselves at the center of the Russian cultural overhaul.
Since many of the Constructivists were also Communists, they eagerly participated in the cultural transformation that played out on an unprecedented scale. The resources at their control were profound, and many of the Constructivists were installed as leaders in the art academies or put in charge of media or industrial design institutions.
Many Constructivists rejected painting in favor of graphic design and photography. Some, like Alexander Rodchenko (pictured above), turned to political propaganda. It was a successful pairing at first, as the visual sophistication of the Constructivists amplified the Communists’ reach and influence. Since the country needed nearly everything produced in Russia to be remade in the new image of Communism, the Constructivists had an opportunity to play a large role in creating that image.
The first five-year plan (1928–1932)
The posters in this story come from the Woodburn Collection, at the National Library of Scotland, and focus mostly on the economic and social issues from the first two of Russia’s five-year plans, to make an appeal to the proletariat. The scope of this poster series was representative of the massive change occurring in the country.
As the political structure of Russia was rewritten, so was its national identity. The Bolsheviks evolved into the Union of Soviet Socialist Republics (USSR), and the Communist Party shifted its focus to transforming the country into an economic powerhouse. This coincided with the transfer of power to Joseph Stalin, who announced the first five-year plan — a device the government used for planning economic growth — on October 1, 1928.


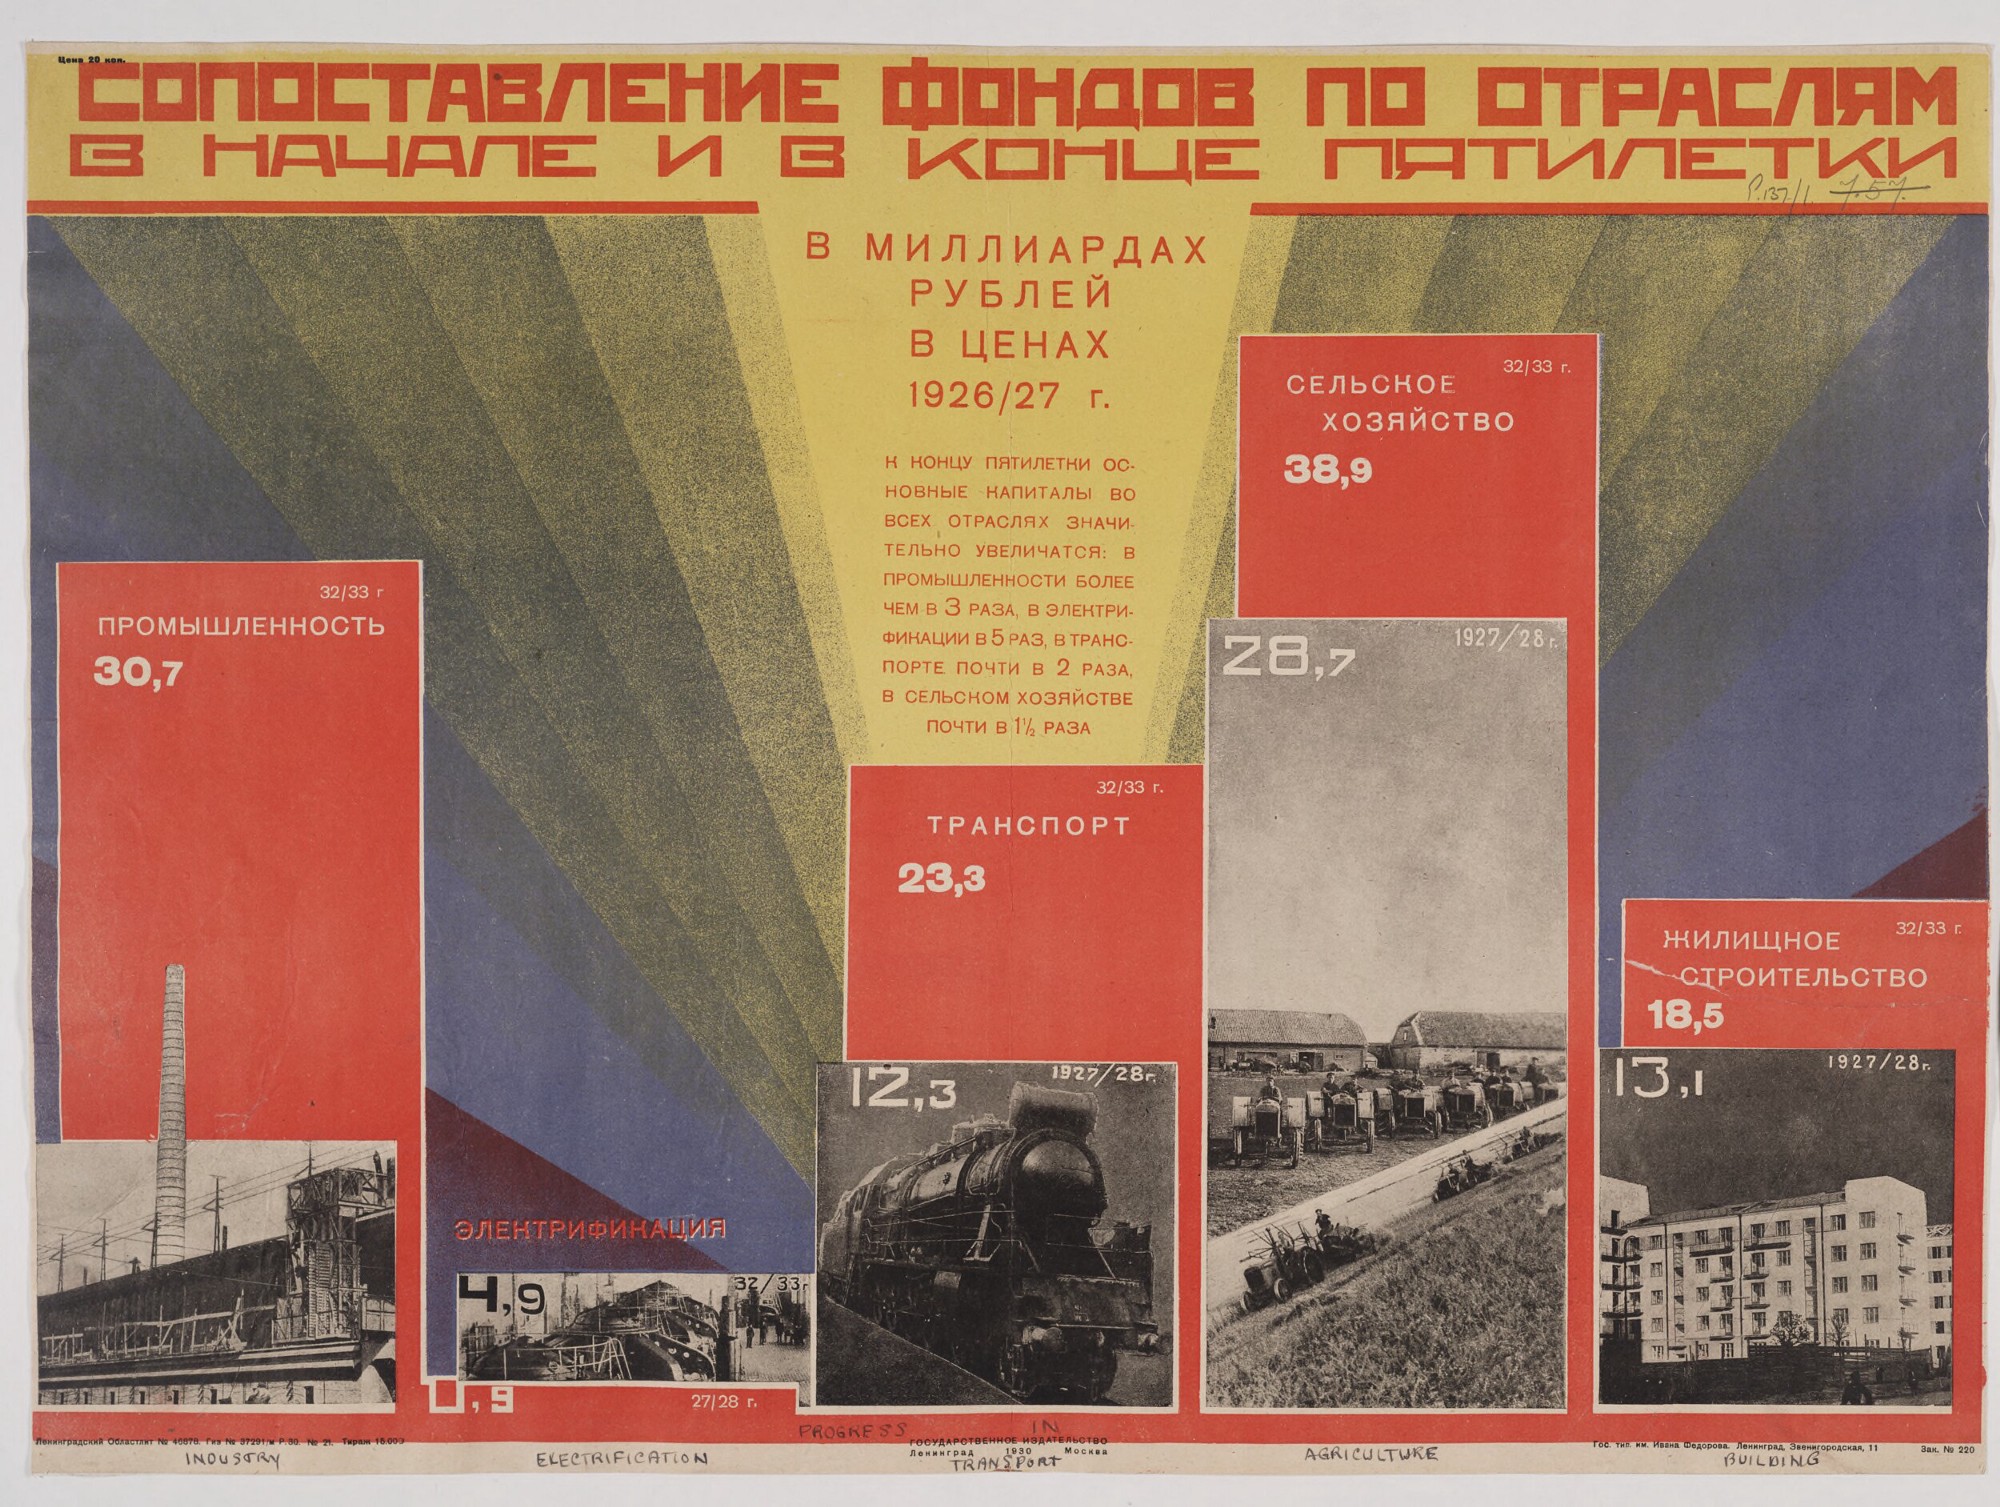
Many of the posters had a specific focus, such as agriculture, health care, chemical manufacturing, transportation, and residential development. These posters employ a Constructivist design aesthetic shot through with a proletariat focus. The designs superimpose simple charts directly onto photomontages that represent the subject matter of the data: tractors march in order, a biplane launches an airstrike against vermin, impeccably clean nurses tend to comrades in need.

Stalin used the first five-year plan to effectively weaponize Russian culture. Facets of the economic growth were dubbed “fronts” or “campaigns,” and workers were even organized into “shock troops.” A popular military metaphor emerged from the economic success of the first five-year plan: “There are no fortresses Bolsheviks cannot storm.”
In each poster, the charts plot the economic output before the five-year plan against the final projection after the plan. The charts aren’t just dropped into the designs, but rather are integrated into the overall composition. Area and bar charts are used as design elements to graphically add to the modernist compositions. Since the data visualizations are integrated into the overall composition, the data is fused to the message of transformation and militarized progress through quotas and measurement.

The data contained in these posters visualizes and celebrates Stalin’s future outcomes. When the first five-year plan started the USSR was fifth in the world in industrialization, and when it ended, it was second only to the United States. Former peasants under the old system were now collective farmers and comrades with the factory worker. Millions were housed in massive modernist housing estates. Like all propaganda, the language in these posters presumes success and presents the state as being successful, regardless of the truth.
Other designs focus on the overall plan. The poster below compares the level of investment in government and collective interests to investment in privately held interests. The pie charts below become Constructivist elements that divide the composition into diagonal rays illuminating and reinforcing the collective industrialization symbology. Investment is equated to toiling farmworkers, train bridges that span as far as the eye can see, and massive factories belching the industrial smoke of progress.

Ultimately, the Constructivists were leftist artists and did not socially integrate with the conservative Communists. Stalin hated the intelligentsia and forced the arts to embrace the Socialist Realism aesthetic. He removed the Constructivists from their positions of power, sometimes expelling them from the country, transferring them to inconsequential positions in the government, or in the worst cases—like Gustav Klutsis, who designed the first poster in this article — simply murdered them.
The second five-year plan (1933–1937)
The first five-year plan was an incredible success in transforming the USSR into an economic powerhouse, but Stalin was far from satiated. A second plan was immediately drawn up with a focus on heavy industry, coal production, communications, and the railways. The collectivization that was transforming Soviet culture increased and the focus on economically triumphing over the U.S. and Western Europe became a theme.

While the date of the poster above is undetermined, it is likely from the beginning of the second five-year plan. It focuses on the consolidation of the workforce into a homogenous proletariat where labor-power is prized over all else. The text from the middle section proclaims: “The work on agricultural rationalization has wide involvement of workers and peasant masses as a main and decisive prerequisite. Only with the decisive struggle with non-productive expenditures, negligence, and carelessness of work, a sloppy and careless attitude to the means of production, and behind the times’ technologies can working people have a final victory.”

With this plan, Stalin stripped all “non-productive” extravagance from Russian society. By introducing childcare, mothers were encouraged to work instead of caring for the family. Churches were closed and the clergy was eliminated by 1936.

This poster also shows the evolution in design style from the angular Constructivist sensibility toward the Socialist Realist aesthetic. While the massive figures — meant to show the journey from repressed peasant to triumphant factory worker — are drawn in the new, realist style, the background continues the diagonal slashes of the previous movement. The type is still set in bold, geometric fonts, and colors are flat and used graphically. Despite the Socialist Realism intentions, the foundations of Constructivism remain evident.

The same trace elements of Constructivism can be seen in the poster “Who Will Win? Overtake Industrialized Capitalism.” This poster illustrates a popular analogy by Lenin. Two speeding trains emblazoned with a swastika (representing Germany) and a star (representing either the U.S.A. or potentially even the Soviets) race toward the future. The brushy, abstracted forms of the trains streak upwards and to the right, echoing the line charts below. In a slash that bisects the composition is the direct quote from Lenin: “We either die, or we catch up with and get ahead of the most advanced capitalist countries.”
The line charts in the poster show the “production growth rate over the past five years by USSR and capitalist countries.” These charts project, unrealistically, how far ahead the Soviet Union would be if quotas were met. Of course, the Nazis had other plans. But Stalin’s investments in infrastructure and industrial development not only prepared the Soviet Union to repel the Nazis’ attempted invasion but ultimately helped them crush Hitler in Berlin four years later.
The Soviet Union created 13 five-year plans in all, extending right up to the dissolution of the USSR in 1991. In a world of Soviet bureaucracy, fulfilling the current plan became the de facto mission. While data visualizations were used to explain many of the five-year plans, exploring the seventh plan helps us to understand how their designs continued to evolve.
The seventh five-year plan (1959–1965)
Nikita Khrushchev launched the seventh five-year plan in 1961, with the slogan “Catch up and overtake the USA by 1970.” As you can see below, data visualizations were still integral to the Soviet effort to spread the message.

By this point, the message was no longer focused on collectivization but on increasing the impact of industrial materials and development. The image demonstrates how increased production of electricity would impact various industrial sectors. The text in the lower left-hand corner says, “In 1980, the USSR will produce 1.5 times more electricity than all other countries in the world [currently do] in 1961.”
The complex nature of these works sought to use data to persuade the populace to believe in the Communist party. The story of the Soviet Union can’t be told by these design works alone, but many of the nuanced and tragic stories from this fascinating period are told in their creation. Perhaps more study will be focused on comparing the data as it’s presented against the historical data so that we might understand which aspects were indeed data-driven and which were simply propagandist messaging.
Thanks to Stephanie Tuerk, for introducing me to this work by presenting many of these images in a series of posts on the Data Visualization Society Slack channel, and thanks to our friends in the #historic-viz channel who expanded and elaborated on her initial post. Stephanie also helped with vital edits and additional insight for this article.
Major thanks to Andrey Lukyanenko and Polina Butrina not only for helping me translate these works but also for helping me understand their historic context. Thanks also to Alyssa Bell, Elijah Meeks, Duncan Geere, Jen Ray, and Noëlle Rakotondravony for the additional editing and support!
To view more of these amazing resources, check out the National Library of Scotland Woodburn Collection and the Russian Posters Collection in the Duke University Library Digital Repository.
Postscript
Earlier in 2021 the Merrill C. Berman Collection published an online exhibition and supporting text about some of the works in this essay plus additional dataviz propaganda from before and after. It is a substantial advancement in the research on this work and very much worth your time.
https://mcbcollection.com/visualization-of-data-in-the-soviet-union


Jason Forrest is a data visualization designer and writer living in New York City. He is the director of the Data Visualization Lab for McKinsey and Company. In addition to being on the board of directors of the Data Visualization Society, he is also the editor-in-chief of Nightingale: The Journal of the Data Visualization Society. He writes about the intersection of culture and information design and is currently working on a book about pictorial statistics.
- Jason Forrest

- Jason Forrest

- Jason Forrest

- Jason Forrest


