
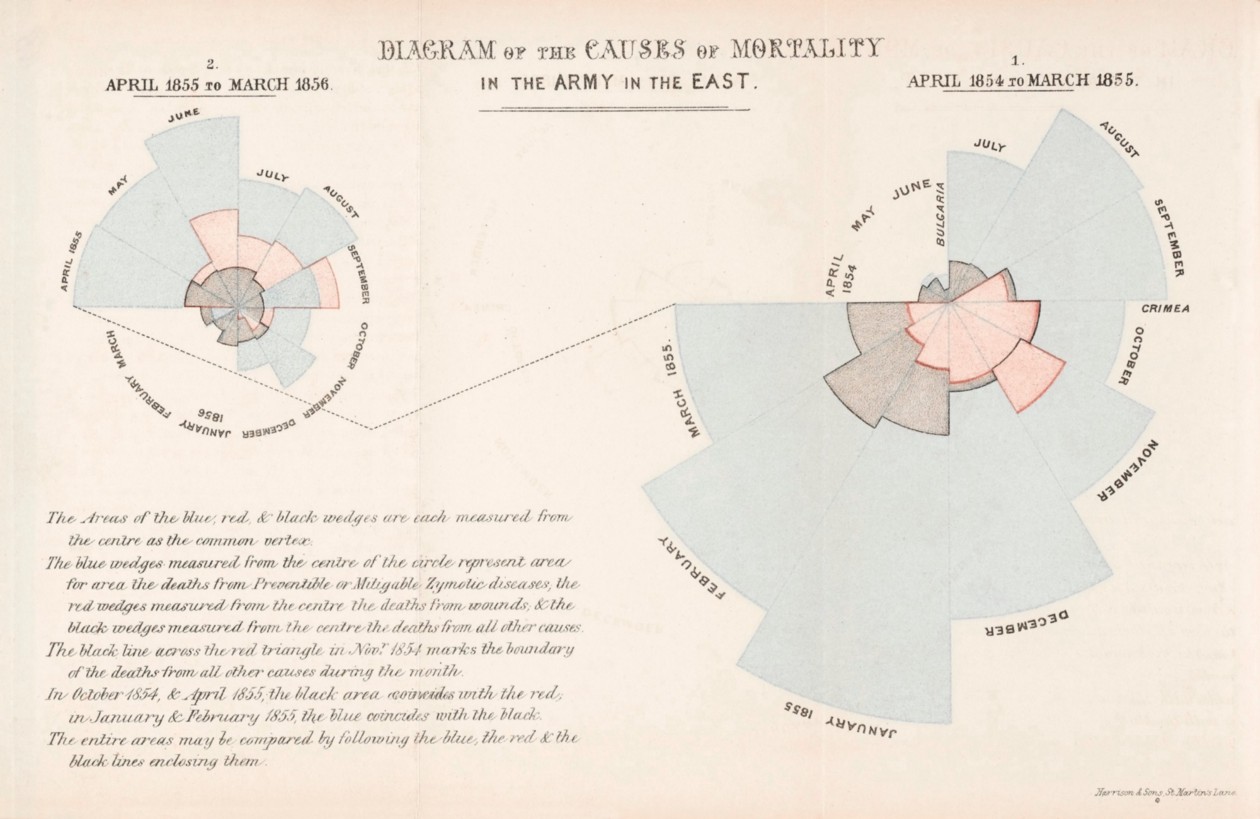
In 1858, Florence Nightingale published a study on the conditions of army hospitals, her seminal Notes on Matters Affecting the Health, Efficiency, and Hospital Administration of the British Army. Her Diagram of the Causes of Mortality had a singular goal: to vividly demonstrate that the lack of proper sanitary caretaking facilities was a far more severe, but also far more avoidable, cause of death for soldiers than injuries suffered in battle. It’s one thing to simply state that the disease killed a lot of soldiers. It’s another thing entirely to effectively and actionably juxtapose it against the casualties encountered at the hands of the opposing army.
Nightingale could have just taken a cue from her predecessors in the data visualization realm and drawn a bunch of bar charts (maybe throw in a line graph if she wanted to get edgy). It would have been the most precise way of capturing the data she spent so much time recording. But, my goodness, what a boring world we’d live in today if she had. And also, probably more soldiers would have continued to die for a bit longer from preventable causes. But mainly, data viz would be more boring; that’s what’s important here, for this article at least.

Pac-man shape of former Ole Miss receiver D.K. Metcalf’s NFL Draft Combine performance). Radial form factors are then optimized if the visualization naturally encodes traditionally radial or cyclical concepts (like launch angles in baseball, directionality of weather patterns, or time/seasons like with Nightingale’s original diagram).
For how it combines impact with enduring popularity, Florence Nightingale’s Diagram of the Causes of Mortality is an objectively cool piece of data visualization (in my absolutely subjective opinion). And over the past year or so, I’ve been tracking down cool, funky, or otherwise interesting works of data visualization. There’s a lot to be learned from deconstructing historical works from pioneers such as Nightingale or W.E.B. Dubois, especially when that work goes against (at least on a surface level) a staid and uninspiring grain. The exercise of discovering, internalizing, then reverse-engineering those same principles that the original authors meticulously considered (this isn’t a Jackson Pollack splatter-paint job; every detail is carefully planned out here) is an exercise that fundamentally improves one’s capacity for creating effective data visualization.
I do data analytics for a bank as a day job, and when I get home in the evening, I do data analytics for basketball. Learning how to effectively weave creative data visualizations into the cases that I present and being able to borrow from inspiration across diverse fields (the wonders of cross-pollination learning!) has been critical to my growth as an analyst and story-teller. Borrowing inspiration from pioneers in the field has been key to spurring that growth. (Oh how far I‘d like to think I’ve come; when I showed Elijah Meeks a network diagram I’d rendered just three years ago, his first reaction was, “Gosh, that’s ugly.”)
Which is why, as a learning exercise, I wanted to recreate historical data visualization but with data sets that interested me. The Nightingale piece was one of the first ones to catch my eye. I turned her exploration of sanitation in army care facilities to something a shade more frivolous: the Diagram of Causes of Mortality for the GOAT in the East, a comparison of LeBron James’ best NBA teammates in the playoffs versus Michael Jordan in his stints with the Chicago Bulls. After all, as I ask in the article, “what is basketball if not a war of attrition?”

Let’s take a look at LeBron’s Miami years from 2011–2013 for an example of how to read this graphic. The blue wedges represent his statistical playoff impact, whereas the pink and dark wedges represent the playoff impacts of his second and third best teammates, respectively. It quickly becomes apparent how the disparity in skill and stature between James and his next best teammates only widened over time (as Dwyane Wade and Chris Bosh aged), leading to his eventual departure back to Cleveland.
Just as with Nightingale’s original work, the radial form factor’s ability to amplify disparities takes a reasonable statement (“Michael Jordan had teammates who were more his equal in his playoff runs than LeBron James has mostly ever had”) and outfits it with flashing neon lights and a blaring Ozzy Osbourne background track. As was the case with its spiritual predecessor, I kept each wedge in my recreation as a temporal snapshot, except instead of months of the year, I mapped each wedge to an NBA season, helping to track more easily the evolution of quantities over time. On the flip side, in order to further make clear the difference between Michael Jordan’s teammates and LeBron James’ teammates, I “preserved” the order of the stacking. When Jordan’s statistics were eclipsed by Scottie Pippen, Jordan’s bar was no longer visible. I took the liberty of using the stacking order to make more profound the overlapping effects. Nowhere in James’ section does a teammate ever eclipse his stats; nowhere in James’ section do you see his blue wedge go missing altogether.

As for the technical milieu of how exactly I created (or recreated, rather) the piece, I used Plotly in Python to build out the base rose diagrams, then did the post-processing to capture the exact texture and style of the original with graphic design software. Plotly is an interesting tool/package because it’s not exclusive to one specific language. It doesn’t occupy the ggplot or matplotlib realm of singular, native associations with programming languages. But it is undeniably versatile, and I’ve found it a more than capable match for a variety of projects now.
![]()
However, if you thought I stopped at Florence Nightingale, you would be mistaken. No historical figure is safe from my pillaging. Not Burtin, and certainly not Minard. In fact, they’re all now going into a book that I’m working on, remixing historical data visualizations to tell basketball stories!
It’s the storytelling part that I keep coming back to in my data visualization journey. I’m roughly paraphrasing, but Elijah Meeks wrote that “data visualization is not a technical problem. It’s a communication problem.” At the end of the day, it’s about conveying information, finding and communicating patterns within data. It’s a two-way street, a shared experience between the creator and the end-user. So rather than beating those end-users repeatedly with a blunt object, let’s all together strive for a little bit more creativity and verve. And if you’re stuck, in need of inspiration on just how to go about doing so, well… I know a certain Lady of the Lamp who could provide a few pointers.
Senthil Natarajan is combining data science and engineering with creative storytelling, working across Fortune 500 companies to the NBA. He can be found musing about sports on Twitter or working on startups out of his apartment. Both his pickup basketball style and his board games style has been compared to J.R. Smith, which may or may not be a compliment.
- Senthil Natarajan

- Senthil Natarajan

- Senthil Natarajan


