
I found out that I was pregnant with my first child in the middle of the first lockdown. I was sitting at my favourite spot in Victoria Park, just one week after the government announced one of the initial easings of COVID restrictions. Around me, people were sunbathing and enjoying the heatwave after endless rainy days. And there I was, crying my eyes out. I was excited, overwhelmed, and insecure. How would I survive pregnancy in the middle of a pandemic? I was in Portsmouth, UK, 3,000 miles away from my home in Israel and did not know the first thing about doctor’s appointments or pregnancy, in general. Plus, all my focus was on my studies; I was at the data collecting stage of my Master’s degree at the University.
When I got back to the dorm room, my husband wiped off my tears and cheered me up immediately. “Change your perspective,” he urged me. “You are a data-driven person. Look at your bookshelf, Observe, Collect, Draw! Do it. Read, collect data on the pregnancy, and make the most of the situation.”
Being pregnant was not a walk in the park. It tremendously increased the number of times I had to excuse myself and rush to the loo. Whenever I was out, I had to make sure I knew where the toilets were, and my bladder couldn’t make it through the night. I was so upset about it, yet there was nothing I could do. Remembering my husband’s words, I had to change my attitude. Thus, the data collection phase began. I put a notebook in our dorm room bathroom and a piece of paper in my purse to collect the number of visits. Every bathroom break, I added a line mark next to the date. I continued collecting data throughout the pregnancy, and I absolutely loved the outcome. It was a great exercise in practicing my data collecting skills, and it encouraged me to change my perspective as my visits to the loo were not mere misery—they served a goal.

The pregnancy made me have butterfingers; I dropped almost every item I was holding. Presumably, my phone suffered the most. Worst of all, I could not bend to pick up my phone when it inevitably fell to the floor. In the beginning, every time my husband retrieved the phone, he’d say, smiling, “You are welcome times X,” where X is his added number of times he assisted me. His charming response sparked my curiosity about the correct number of dropped items, and I started collecting the data on these clumsy mishaps. I hated dropping things, and as the frequency increased, my irritation levels rose to a boiling point. I started to swear like a sailor. I recorded my reactions in these moments, too. When I reached the end of the second trimester of my pregnancy, my husband and I decided to fly back to Israel and continue our studies via Zoom. When we moved, I misplaced my notebook with the data collected. It probably slipped through my fingers when packing and I had to retrieve part of it from memory. For that reason, I removed all numbers and made a bar chart presenting the comparison between trimesters and responses.

Time throughout my pregnancy passed by very quickly. With a blink of an eye, I had my newborn son in my hands. I was trying to find my pathway in this “unknown territory” called motherhood. Even though I was confident in my ways, that time just after my son’s birth was overwhelming.
When Ethan was two and a half months old, I believed I was doing everything wrong. It was chaotic. I did not feel like me anymore. I was Ethan’s mum while also trying to fit in my roles of being a person, a designer, and a wife.
Whenever I craved some “me” time, I would go out for a walk around the neighbourhood. Usually, the rays of sunshine cured everything and put a smile on my face. But then, the presence of other people on that sidewalk—all with unwanted advice and unpleasant questions or comments—was infuriating. Every time I received unwarranted advice about Ethan, my emotions would elevate and I would text my husband for moral support. Alas—another opportunity to collect data. One quiet afternoon I read all our back-and-forth texts and tried to find a pattern. I found some comments from strangers to be ridiculous, comments about covering Ethan with a blanket due to the air being too cold, and some the opposite. I cumulated the amount of advice I received and added the number of questions I asked on social media. I wanted to present the balance without “over-explaining” it. The solution was a fabulous vis showing the advice I asked for compared to critical comments.

Since Ethan was two days old—before he was even named Ethan—I have been collecting his every move using a “Baby Tracker” mobile app. I gathered data on food, sleep, exercise, poop, amongst other stuff. Tracking him made me feel like a skilled mother, as it helped me foresee when he would be tired or hungry based on past data.
When Ethan was five months old, we went to the doctor for a regular check-up. The doctor asked me about time spent on his tummy, suggesting that he should be doing this for at least five minutes a day. I took out my phone, and with a few clicks on the app, I could see the amount of tummy time I had measured. Happily, I discovered that he was spending a tremendous amount of time on his tummy, data I could not have known from observation alone.

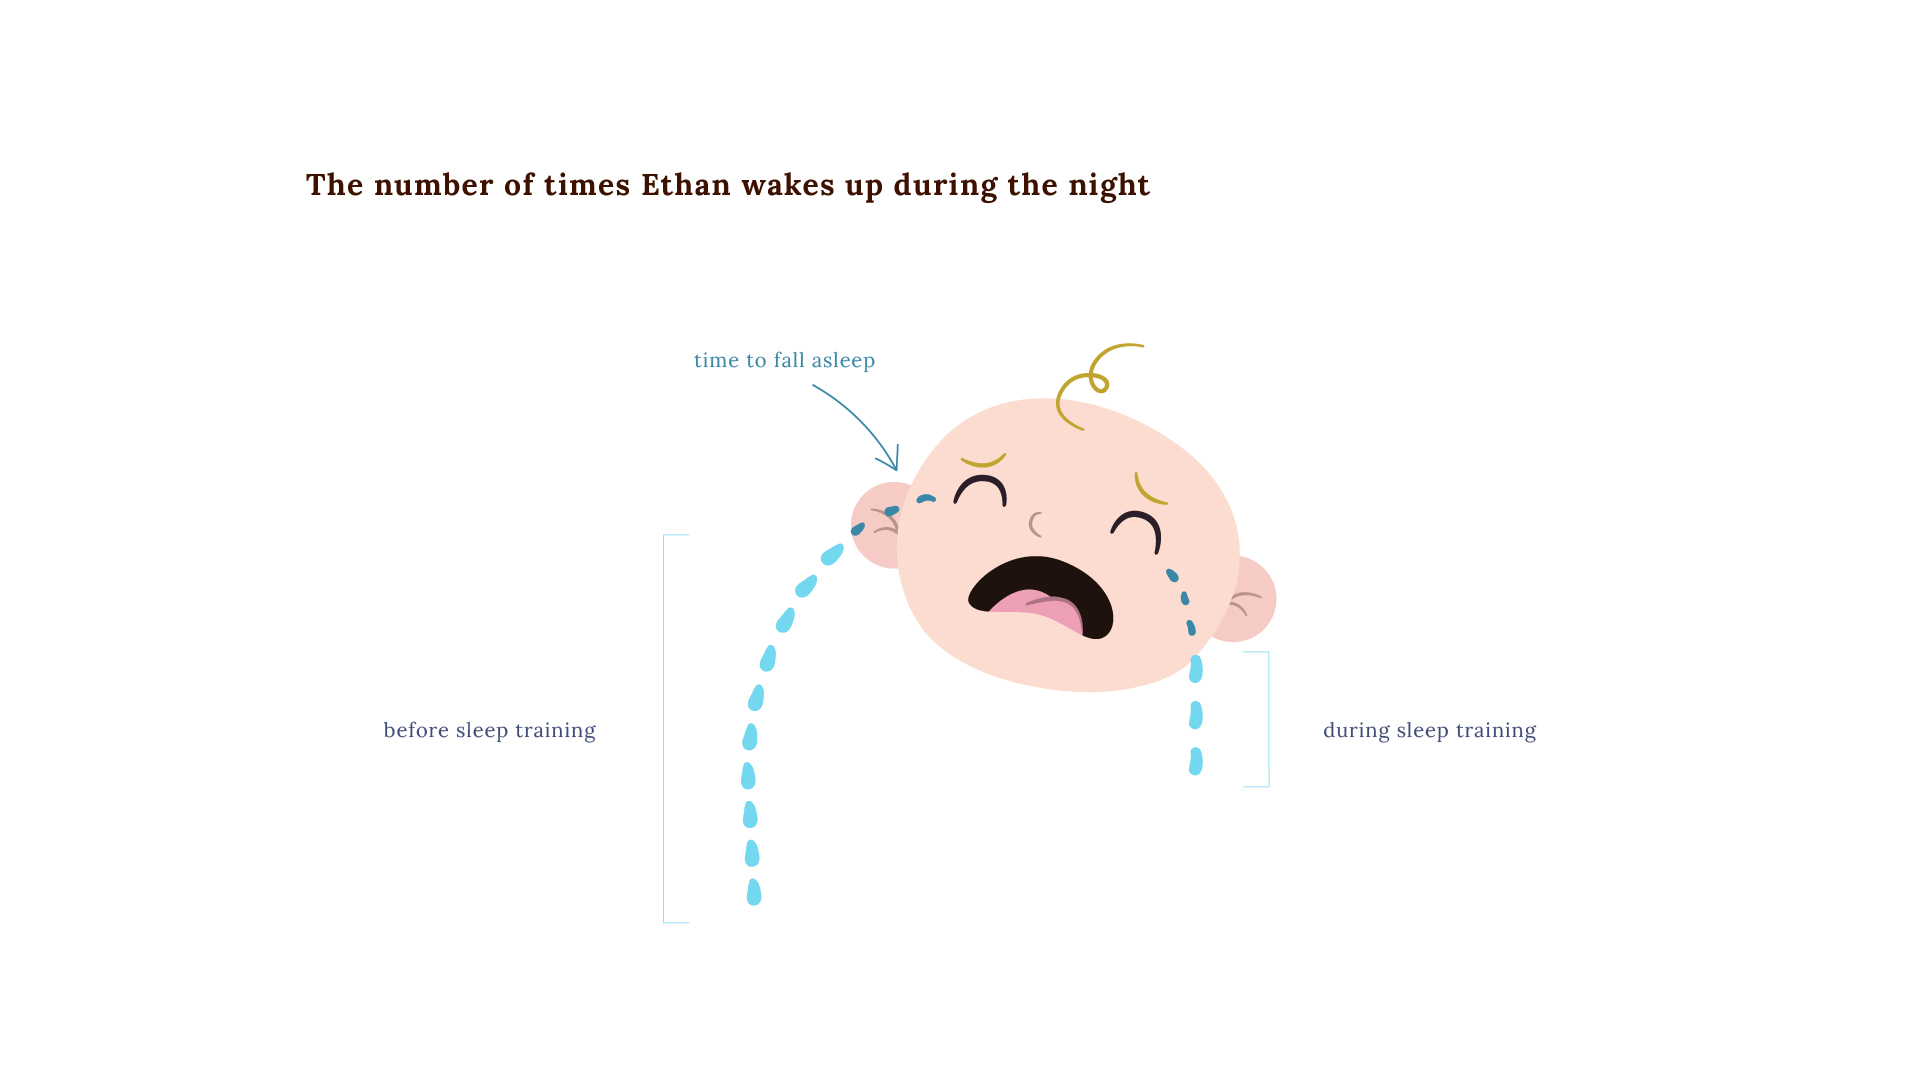
Every month delivered new challenges and struggles. By the time Ethan was six months old, he was waking up a lot at night. I was losing my sense of self by waking up every hour and twenty minutes. Whenever I was designing a vis, I pondered something a professor told me in undergrad about sleep impairing creativity. I learned firsthand that this is true. Sparking a creative way to convey the data was easy; however, practising data vis and applying Alberto Cairo’s rules that I recently learned in my Master’s degree was difficult. For example, “eliminating things that do not support the narrative” was the hardest to follow. My visualisations appeared crowded with decorations, diverse data, numbers, and long titles. Luckily, we hired a sleep trainer who helped Ethan (and, by proxy, me) sleep better. This extra sleep, in turn, helped me with designing.

Ethan is now just short of one year old. I do not have the perfect equation for being a mum. But one thing I do know now is that motherhood is a matter of perspective. I decided to look at my struggles, problems, and difficulties as an opportunity and seek the story within the data. I chose to learn from my observations, and I was determined to search for patterns within the data. I resolved conflicts using the data, found solutions, and viewed the learning curve.
Overall, I am grateful for the data that helps me understand my baby’s life experience better. I’m continuing to collect data, especially about his day naps, which helps me optimise naptime and reduces the amount of crying.
I am longing for the pandemic to be over, affording us the ability to fly back to the UK and visit Victoria Park. I want to show my son the place where I felt as if the world was caving in on me and share how blessed I am that it all happened.
Check out my Instagram for more vis.

Or is a critical thinker and an enthusiastic data-visualisation designer who finds patterns in everyday life and transforms them into clear, meaningful visual stories. She previously lead the UX & Data Visualisation within the Business Intelligence department at IEC. She just started a practice-based PhD exploring how data visualisation can support more balanced decision-making for people living with diabetes.
- Or Misgav

- Or Misgav

- Or Misgav

- Or Misgav


