
The DVS Mentorship Program revolutionized my creative process: learning is iterative, failure is vital, growth comes in many forms, and straight lines are overrated.
No experience exists in a vacuum. It is impossible for me to talk about the impact of the DVS Mentorship Program without talking about where I started. How I experienced the mentorship was so much about how I learn and how I work through personal projects.
Where I Started
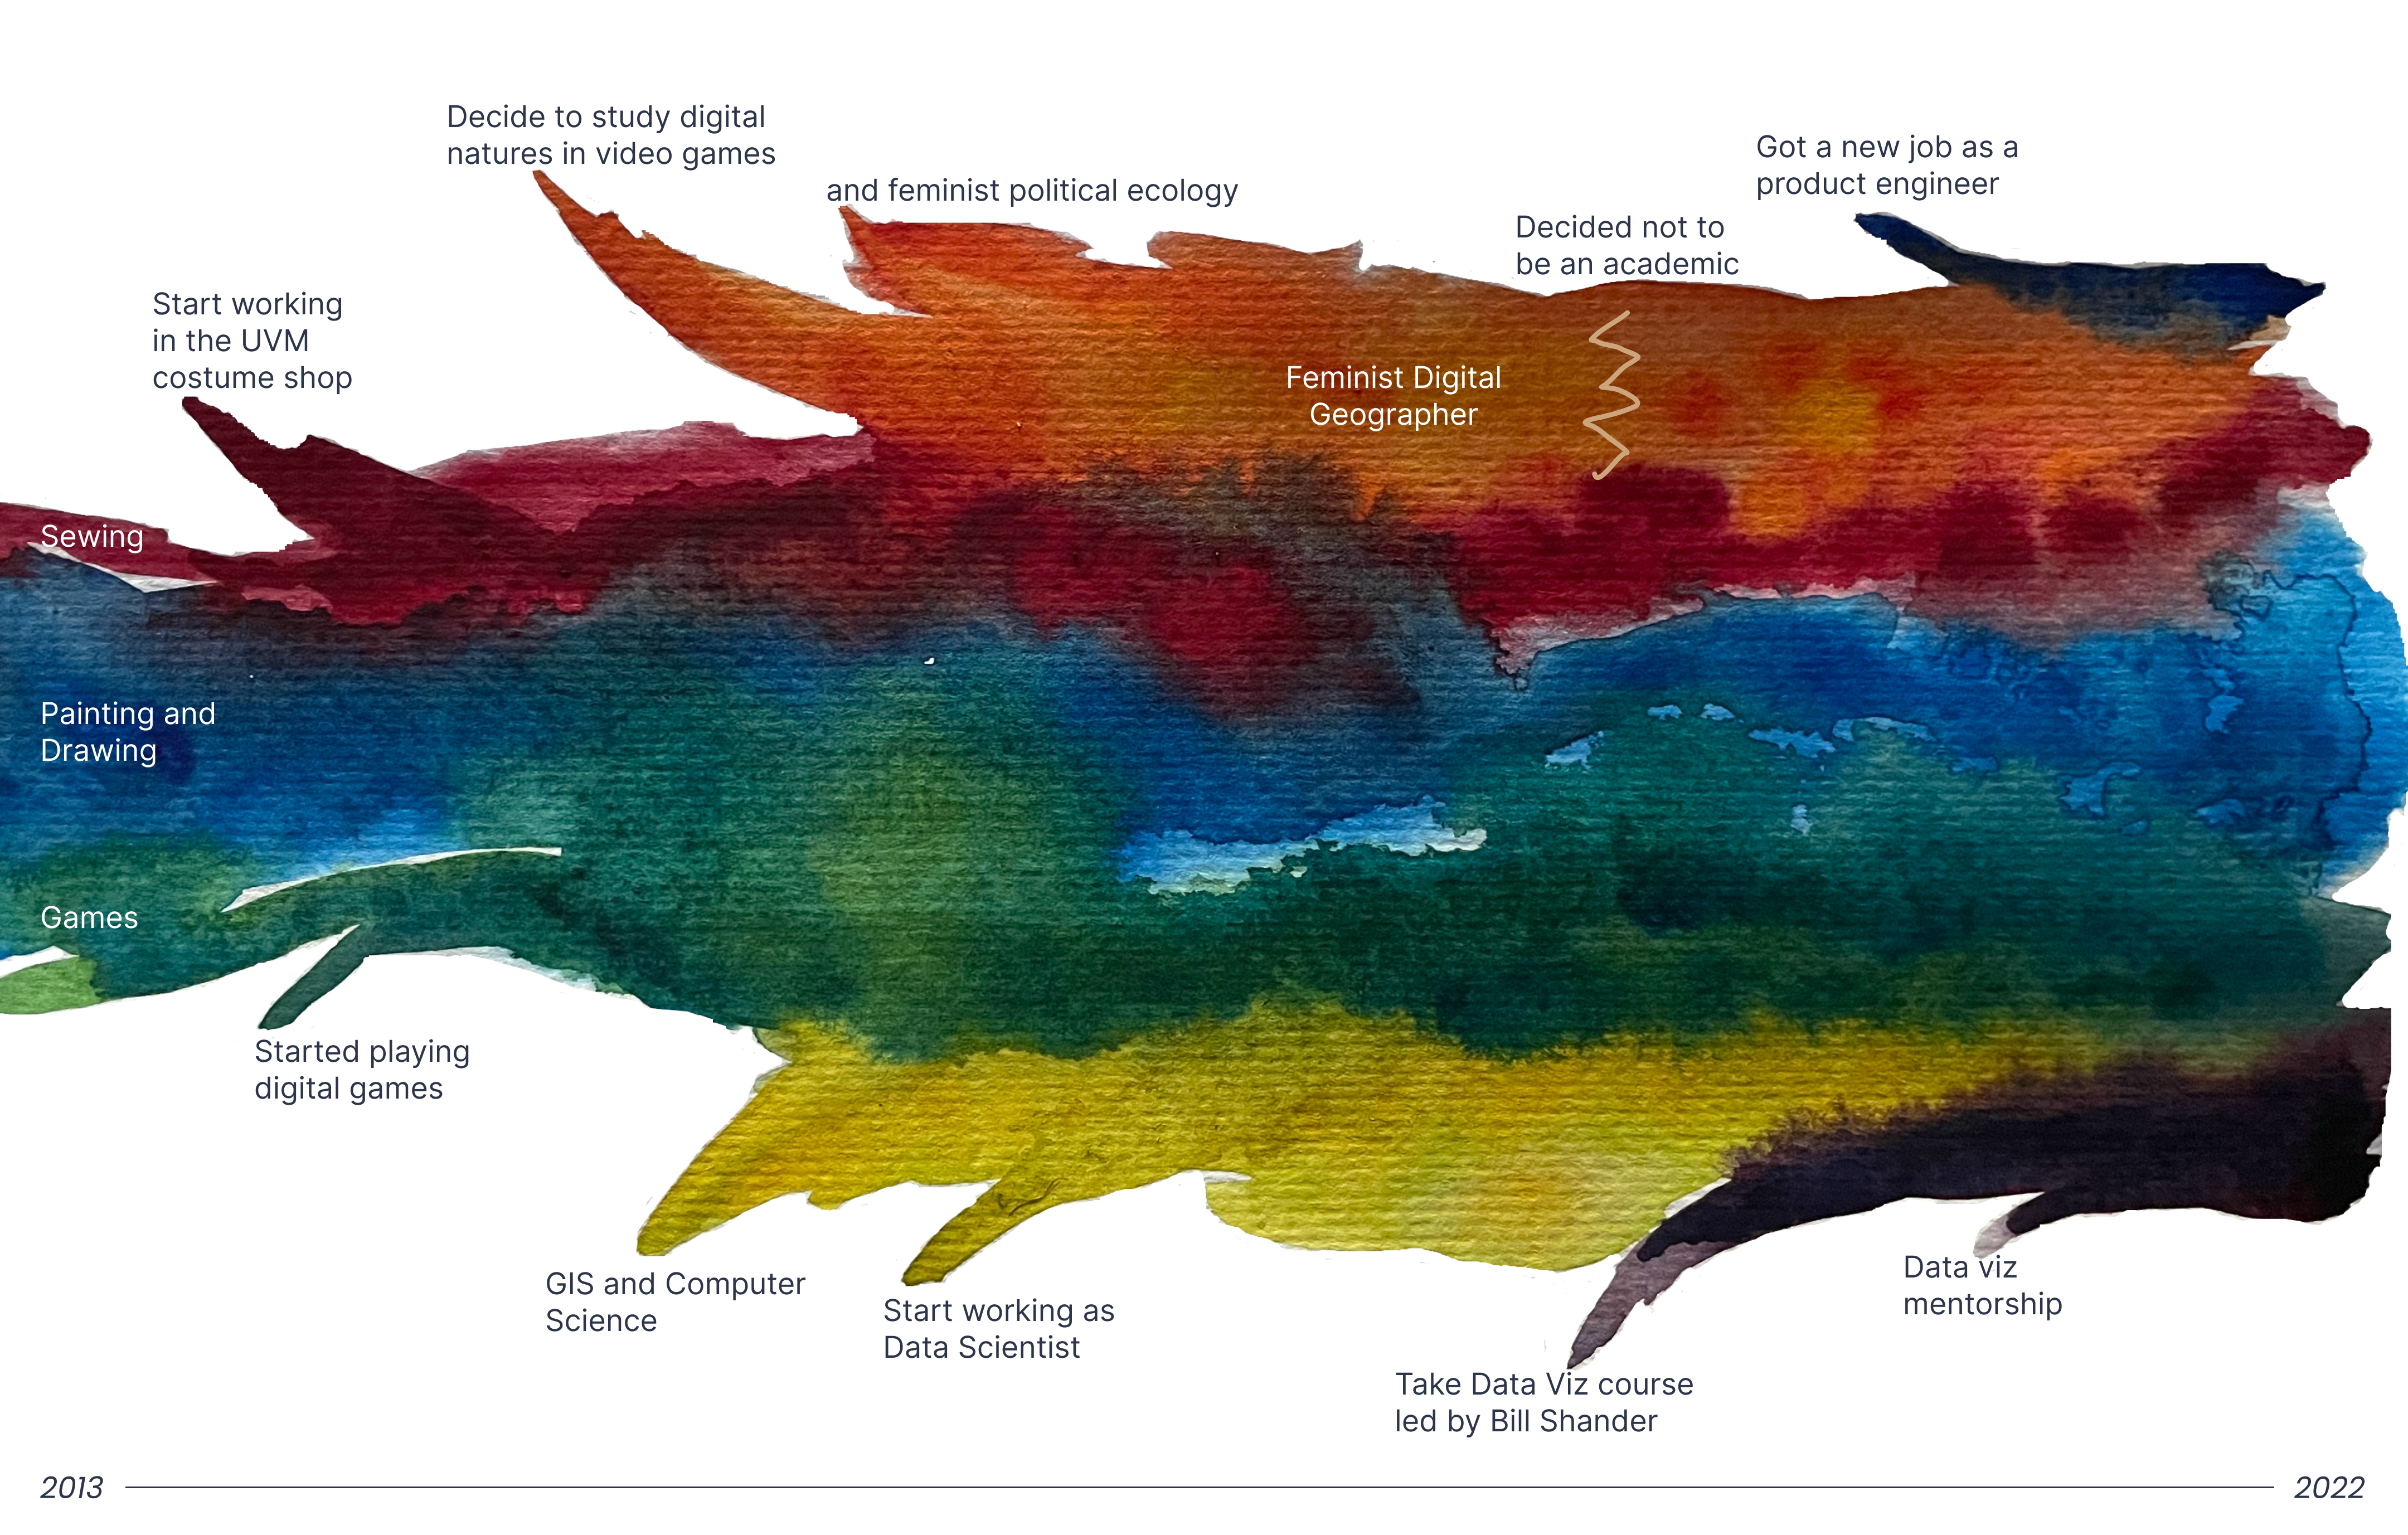
I have been an artist all my life. My dad was a potter for most of my childhood. My mom taught me how to sew when I was six or seven. My great grandfather was a tailor. My great grandmother was a stained glass artist. One grandmother was a seamstress and the other was an artist and crafter who loved doing projects with her grandchildren. I learned art and creativity from a young age, and it has stuck with me in various forms. So on the side of all my academic and professional experiences is the thread of creating things, particularly visual things. Weirdly though, I haven’t given this creativity a lot of space in other aspects of my life.
I have also played games all my life. As a kid, my dad would lead D&D adventures for my cousins, create puzzles and treasure hunts for birthdays, and we always had a large collection of board games. In the summer of 2013, I was introduced to digital games. I started playing games as a fun break from my undergrad studies, but they eventually became central to my academic life. I majored in geography and minored in GIS and computer science. Games became a way to explore my interest in people’s relationships to place, and the technical construction and human experiences of nature in digital spaces.
After grad school I decided that I very much did not want to be an academic. I still loved games and exploring experiences of digital space, but I had no interest in academia as a career. At this point my professional life turned to GIS and data science, while studying human experience and nature in digital games became a fun side project with an academic friend exploring questions like, “How do games enable multidimensional experiences of grief, memory, joy, death, and hope?”
In the last several years I have really struggled with how to reconcile all of these interests and experiences with each other. Especially how to integrate the creative with the analytical and professional aspects of my life. I felt really torn between them; unable to really devote the time to any one of them, but needing them all. I applied to the DVS mentorship program hoping that it might give me some insight into whether dataviz was a career direction that could integrate them.
DVS Mentorship Program
I applied for the DVS mentorship program at a time when I was feeling burnt out and frustrated with my data science job. I was looking for something that felt more aligned with what I wanted out of my career; something that used more of my creative skill set. I thought maybe I would like to work in dataviz, but felt that I didn’t have enough specific skills to get the job I wanted. So I signed up for the mentorship program to learn some new skills and gain some dataviz confidence.
When I first met with my mentor, the amazing Alicia Bembenek, we discovered that we had a lot of similarities in the roads we had taken, particularly with our experiences of academia. I had broken up with academia after grad school, Alicia had been a professor before deciding to leave academia for dataviz work. This is when I knew that the mentorship was going to be great. In Alicia, I found exactly what I was looking for: to be able to talk to someone who had made the lateral transition I was thinking about as well as from whom I could gain skills and insight.
For the technical part of the mentorship I created a viz using a dataset based on the games that I play. I had already been thinking a lot about how and why I play games for the project I was working on with an academic friend of mine. Doing a more analytical assessment of my games library in terms of hours played, game mechanics, and primary motivations was both fascinating and supported two projects at once. I kept a blog of the process and the final viz is available on Tableau Public. While the blog tracks the details of the mentorship, I wanted to share what I felt like were the key pieces that made it successful and the lessons that I will take into other parts of my creative process.
My newly discovered (dataviz) process
A huge part of this mentorship experience was about figuring out my dataviz process and how I fit dataviz into and around my job and other creative projects. For me there were two key cycles in creating dataviz: “What is the story?” and “How do I tell this story effectively?”

What is the story?
This cycle is about cleaning, curating, and exploring data until you discover the story you want to tell. From my data science background, this is the part of the process that I was most comfortable and familiar with.
Lessons learned
- Pick something that feels personally engaging and compelling. This could be personal data or data about something that matters to you. If you are not interested in the data, it’s much harder to create an interesting viz or to find the motivation to work on the project.
- It can be very helpful to enhance the data with additional information from other sources. I picked a dataset that was based off of the information in my Steam games library, but ultimately it wasn’t all that interesting by itself. It told me what games I played the most recently and most frequently, but not much else. I made the dataset much more interesting by adding my experience of those games and the time I spent playing them.
How do I effectively tell the story?
This cycle develops the story through charts, text, and design. This is the piece of dataviz that I felt the least comfortable with when I started the mentorship program. I have a hard time telling linear stories and I get distracted by all the possible things I could talk about in a viz. I often have no idea where to start because there are so many possibilities.
Lessons learned
- Ask a bunch of questions about the data and what is interesting about it. One of these questions will be the main story. Then figure out which questions each chart in the viz is going to answer. This allows the initial phase to be a little all over the place. I can dump out all the exciting possibilities and then sift through them to find the ones that are the most interesting and that tell a complete story.
- Sketch out the story. On paper. This is one of those things that was maybe a bit obvious, but I needed to be reminded. Getting out some colored pens and drawing out the possible layouts and flow of the story on paper relieves some of the pressure and time of trying to work through a chart or a viz in Tableau, or even having to hold it all in your brain. It’s also really fun and has a much more exploratory feel.

Dataviz is iterative
This is perhaps the most important lesson I learned. Letting go of any expectation that I would start with a dataset and proceed in a linear fashion to a dataviz was my biggest breakthrough. As I said, I don’t think linearly, I don’t imagine stories linearly, so maybe this should have been obvious to me, but it wasn’t.
A lot of my experiences of learning up until this point have been structured in a linear way. I also came from academia where everything is linear. So it took me a while to shake off those old habits. Once I did, however, it was an immense relief.
The project doesn’t have to be perfect the first time. I don’t have to wait until the dataset is just right. In fact, I will get to the dataset I want by trying what I have with some charts and designs and then realizing what is missing. Sometimes I scrapped entire charts or sections of the data after hours of work because I realized they didn’t fit. This is not wasted effort. I learned how to make those charts. I also learned how to prune my story and refine my storytelling. Starting the design process before I was 100 percent confident that I had the data I wanted helped me clarify the story. At the same time, the designs changed the direction of the story because I began to realize what I really wanted to say.
The flowchart of my dataviz process is actually a reliable model for any project. I get stuck in trying to make it perfect from the beginning and then I freeze under that pressure and end up not doing the project. The lifecycle of any project is iterative. “Failure” is an important part of creativity. Going back to the drawing board doesn’t mean the earlier steps in the project were a waste of time.
Progress isn’t always what I think it is. Before starting this program I did most of my projects start-to-finish in one day. By the end I wouldn’t necessarily be enjoying myself anymore, but I would feel like I had to finish the project. This mentorship began just before I started a new job and so I couldn’t really dedicate my time to it in the same way. I could set aside a chunk of time on the weekend and then work on it an hour here or there throughout the week. Initially I felt like I wasn’t getting very far each week, but at every meeting with Alicia she would be excited about the work that I’d done. I slowly realized that I just needed to change my expectations of what progress looked like, especially since the process is iterative. I might have spent the last few weeks working up through a design prototype and then find myself back tweaking the dataset, but that doesn’t mean that I’ve somehow gone backwards. It’s simply part of the process. I had to change how I measured success. Ultimately, it’s been a positive change, not just in my dataviz process, but also in how I approach projects in general. It’s a far more sustainable way to work.
Dataviz, like all of my other creative pursuits, is what I want it to be. At the moment I don’t do it for anyone other than myself. It is the story I want to tell, the way I want to tell it. This experience has both reminded me that I can and it encouraged me to combine all of the seemingly random pieces of my education and interests. I brought to the mentorship all of these different skills and experiences, but I was at a loss about how to reconcile them with each other–feeling like I had to pick and choose and rarely feeling like I was growing in any particular one. I walked away having created a single viz that somehow encompassed all of them. Most importantly, I found a way to approach projects more honestly and authentically to how I live in the world. I discovered a way to grow and learn and change in a distinctly messy, non-linear way.

Emma Tait is a data visualization enthusiast with an extensive background in geographic information systems, cartography, web and database development, creative design, and visual art.
- Emma Tait


