
Published for Tukey Day, June 16, the 107th anniversary of John Tukey’s birth
This article recounts the origins and influences of the movement in statistics and data visualization dubbed Exploratory Data Analysis by John W. Tukey and developed by students who caught the EDA-bug in the period 1960–1990. In 2022, the 52nd anniversary of the launch of the preliminary volumes of EDA, we trace the history of this topic through discussions of the changes in thinking and practice that made this a paradigm shift in statistical thinking and data analysis. This article is a result of an email collaboration among many researchers who give their perspectives on the rise of EDA and its current influence.
This article began with an historical reflection related to an R package two-way (Friendly and Heiberger 2020) for analysis and graphic display of two-way, n=1 tables in the EDA style of John W. Tukey (JWT). The observation was that Exploratory Data Analysis was at its Golden Anniversary, and it would be useful to record the recollections and insights of a group of influential researchers in data analysis and graphical methods who witnessed and contributed to what I’ll dub the “EDA Movement.”
To this end, I sent an email call all those who were first, second, … academic descendants of Tukey, and a growing list of others who participated in this development. My initial instructions seemed simple …
Let me frame the questions as:
- What impact did EDA have on your teaching, research and writing?
- What impact did it have on the fields of statistics and data visualization?
The responses among this group (~ 25-30 correspondents) were overwhelming in number and detail, often highly personalistic, but also giving insights in previously untold stories. This article attempts to do at least some justice to the thoughts of my co-conspirators under the rubric of my title, Remembrances of Things EDA.
This review is also informed by several biographies of JWT, particularly: Brillinger (2002) and McCullagh (2003). As well, Hoaglin (2003) reviews Tukey’s wide contributions to data analysis.
EDA: a paradigm shift and revolution in statistical practice
“Exploratory Data Analysis”, most prominently connected with the work of John W. Tukey (but not limited thereto), can be said to be one of the most prominent revolutions in statistical thought and practice in recent history, and perhaps for a very long time. Such seismic shifts in the fundamental ideas that focus new research and the transmission of these through teaching and publication have been called “paradigm shifts” by Thomas Kuhn (1970) and other modern philosophers of science.
Some prominent quotes identify the key features:
Far better an approximate answer to the right question, which is often vague, than an exact answer to the wrong question, which can always be made precise. — J. W. Tukey (1962) “The future of data analysis”
There is nothing better than a picture for making you think of questions you had forgotten to ask (even mentally). — J. W. Tukey & P. Tukey (1985)
In statistics, one can also point to the Bayesian Revolution that started with Thomas Bayes (1763). But it took 300+ years to become a more mainstream topic that now influences current teaching and practice, though not universally. Modern Bayesian thinking is similar to EDA in that both entail opinionated views of:
- how data analysis and statistics ought to be done;
- they gained prominence as ways to go beyond the classical, frequentist and inferential approach which had dominated statistical thinking in the first half of the 20th Century;
- adherents often evinced a nearly religious zeal to spread the message to colleagues and students.
EDA and Bayesian methods differ, of course, in that EDA focuses more on informal, discovery techniques, while Bayesian methods are largely in the confirmatory, inferential camp, but attempt to take prior, intelligent belief into account to judge the strength of evidence. The idea that subjective beliefs could, and should, be incorporated into a rigorous inferential methodology attracted many to the Bayesian bandwagon, just as EDA attracted those who saw “data analysis” as a more scientifically oriented take on mathematical statistics.
Historically, there were other paradigm shifts in natural & social science. Between 1510–1550, Copernicus presented a solar-centric cosmology that overtook the earth-centric model that had reigned from the time of Aristotle and Ptolemy. By 1880, a germ theory of disease transmission overtook the theory of miasma stemming from Galen’s “On the Different Types of Fever” (c. AD 175) which ascribed disease to seeds present in foul air.
Closer to the present and philosophically related to EDA, the cognitive revolution of the 1950s–1980s moved away from behaviourist approaches to accept cognition as central to understanding human behaviour, even if its mechanisms could not be directly observed. What later became known as “cognitive science” sprouted new views and methods in psychology, linguistics, computer science, anthropology, neuroscience, and philosophy.
Some inner mechanisms of human memory were described in George Miller’s 1956 article, “The Magical Number Seven, Plus or Minus Two” (Miller 1956). Noam Chomsky’s Syntactic Structures (1957) provided a novel view of linguistics that gave psychologists new ways to think about language use and development. Work in a nascent area of artificial intelligence by John McCarthy, Marvin Minsky and Allen Newell was made prominent to cognitive psychologists by the 1958 article “Elements of a Theory of Human Problem Solving” (Newell, Shaw, and Simon 1958).
In this time, revolutionary ideas in science, philosophy, statistics and psychology were in the air, not to mention political and social change. It is within this context that EDA arose and prospered.
What is EDA?
We take the view here that EDA is primarily an attitude toward data analysis, a philosophy of statistical practice and research, centered on graphical display, and also a guide to teaching. Tukey set this tone in the opening sentence of Chapter 1 the Orange Book,
Exploratory data analysis is detective work — numerical detective work or counting detective work — or graphical detective work Tukey (1977), p. 1
But it has also been identified or defined:
- as a collection of computational and graphical methods (five-number summary, stem-and-leaf plot, boxplot, two-way table plot, …),
- in relation to the collection of books ranging from the preliminary editions of EDA in 1971-1972, to the Orange Book (Tukey 1977) and beyond,
- in relation to a variety of software packages (SNAP/IEDA, EXPACK, Data Desk, SYSTAT, …) that began to make these methods more accessible.
Origins
Although some of these ideas have deep historical roots, for the present purposes, it is useful to date the origin of EDA to Tukey’s (1962) paper, “The Future of Data Analysis”, published in the prestigious Annals of Mathematical Statistics. Here, Tukey sought to establish data analysis as distinct from the dominant, formal view of mathematical statistics in that time. He emphasized the applied role of data analysis in research and scientific discovery, rather than in formal mathematics, which he states is not actual science, because “its ultimate standard of validity is an agreed-upon sort of logical consistency and provability.”
For a long time I have thought I was a statistician, interested in inferences from the particular to the general. All in all, I have come to feel that my central interest is in data analysis, which I take to include, among other things: procedures for analyzing data, techniques for interpreting the results of such procedures, ways of planning the gathering of data to make its analysis easier, more precise or more accurate, and all the machinery and results of (mathematical) statistics which apply to analyzing data. —Tukey (1962), p. 2
From this, he asked a provocative question:
Is it not time to seek out novelty in data analysis? — Tukey (1962), p. 3
Tukey goes on to emphasize the role of data analysis in research, rather than mathematics, statistics, and probability:
Data analysis, and the parts of statistics which adhere to it, must then take on the characteristics of a science rather than those of mathematics, specifically:
(bl) Data analysis must seek for scope and usefulness rather than security.
(b2) Data analysis must be willing to err moderately often in order that inadequate evidence shall more often suggest the right answer.
(b3) Data analysis must use mathematical argument and mathematical results as bases for judgment rather than as bases for proof or stamps of validity.
This attitude and focus on data analysis likely influenced the title, “Data Analysis, Including Statistics” of a long chapter in the Handbook of Social Psychology by Fred Mosteller and JWT (Mosteller and Tukey 1968), targeted to applied social science researchers.
To the orthodoxy of mathematical statisticians at the time, more interested in theorem-proving and abstract theory than in understanding data, this might have seemed like Martin Luther’s nailing the “95 Theses” to the door of the Wittenberg Castle church on October 31, 1517. Yet, Tukey, from his previous work, had sufficient gravitas that this call to arms for “data analysis” to become respected as an important goal of “statistics”.
The connection of EDA with the history of data visualization should be noted here. Elsewhere (Friendly and Denis 2001; Friendly 2007; Friendly and Wainer 2021), I have characterized the period ~1900–1950 as the “Modern Dark Ages” of visualization, because the sway of formal, mathematical statistics, and precise parameter estimates from statistical models had supplanted the enthusiasm for graphics in the last half of the 1800s. Pictures were—well, just pictures, however pretty. They were incapable of stating a “fact” or p-value to three or more decimals. Or so it seemed to many statisticians.
I dub the period ~1950–1975 the “Re-birth of Data Visualization,” and Tukey’s 1962 paper was one of the turning points. Graphical methods became a respectable field of inquiry and made data analysis (as distinct from statistics) exciting, or even geeky-sexy. Usefulness for understanding some real phenomenon began to trump mathematical precision as a criterion for judging new methods.
More recently, the new applied nature of data analysis, was infused with (or colonized by) recognition in computer science that these were interesting topics. Just as the cognitive psychology I learned in the 1970s was re-branded as “Cognitive Science”, a new profession of “Data Science” emerged as a multidisciplinary one, focused on a goal to make sense of increasingly larger stores of “big data”. EDA figures here in practice and teaching, where data cleaning, “tidy” data (Wickham 2014), and exploratory graphics are seen as necessary components of the data analysis process. Peter Huber is less sanguine about the connection :
I am afraid that nowadays the ‘data science’ people seem to be concerned with datasets so massive that they no longer can explore them (and leave that task to blind batch processing).
The EDA Canon
The defining book of EDA is often considered to be “The Orange Book”, aka “EDA77” (Tukey 1977). However, the materials that would form this book were first prepared as three photocopied volumes of the limited preliminary edition (Tukey 1970a, 1970b, 1971) that I’ll also call “EDA71”. The very first version was called “An Introduction to Exploratory Data Analysis” prepared for Tukey’s Statistics 191 course in Fall, 1968.
Students who took Tukey’s EDA courses in 1968–1970 at Princeton were treated to one or two new chapters handed out each week. Although the text was produced on typewriters, Tukey’s typography was a challenge for the Bell Labs typists, and this manuscript edition reflected Tukey’s deep thoughts about how to present his ideas in text. Dave Hoaglin recalls:
In the 1969-1970 academic year I helped JWT teach an undergraduate course at Princeton (Statistics 191) based on chapters from the immediate precursor of the limited preliminary edition.
In 1970-1971 I used the limited preliminary edition (maybe only Volumes 1 and 2) in a graduate course at Harvard. Fred Mosteller probably included some EDA when he taught Statistics 100. As far as I know, he did not use the limited preliminary edition or the orange book. Of course, the 1977 Mosteller and Tukey green book included EDA techniques.
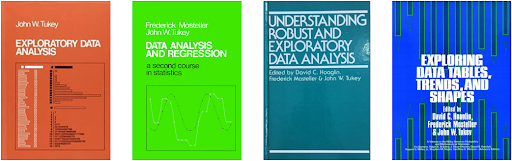
A few years later, three further volumes appeared, edited by what has been called “The Cambridge Writing Machine”: David Hoaglin, Fred Mosteller, Tukey, and John Emerson. The first, Data Analysis and Regression: A Second Course in Statistics (DAR, the “Green Book”, Mosteller, and Tukey (1977)) was an extension of the 1968 Handbook chapter written in the style of the Orange Book with extensive hand-drawn plots. It included the jackknife technique for cross-validation, outlier-resistant regression and a graphical, fitting by stages approach to multiple regression. The next, Understanding Robust and Exploratory Data Analysis (UREDA, Hoaglin, Mosteller, and Tukey (1983)) contained chapters highlighting various topics at a deeper level than in the Orange book (analysis of power transformations, robust methods considered more broadly). The third book, Exploring Data Tables, Trends and Shapes (EDTTS, Hoaglin, Mosteller, and Tukey (1985)) extended these ideas further. Collectively, these volumes have been dubbed “The Statistican’s Guide to Exploratory Data Analysis”. Although a few correspondents disputed the direct contribution of the Orange Book, the others — DAR, UREDA and EDTTS — were more suitable as textbooks and were widely adopted.
Tukey was certainly prolific in a variety of papers and presentations on various aspects of what he came to see as “data analysis” as distinct from classical mathematical statistics. Many of these were assembled in five edited volumes, The Collected Works of John W. Tukey (CWJWT). Volumes III and IV cover his ideas related to the philosophy and principles of data analysis, in 1949–1964 and 1965–1986 respectively (Jones 1986a, 1986b). Volume V, “Graphics, 1965–1985” (Cleveland 1988) covers a wide variety of contributions to data graphics. A comprehensive bibliography of Tukey’s works (63 books, 548 articles, 105 book chapters) is available here.
Stephen Stigler gave this assessment of Tukey’s impact factor from the Orange Book:
Unlike many of the rest of you, I was not a student of JWT. But that will not stop me from advancing a hypothesis. It is this: Yes, EDA (the subject as filtered through JWT) was immensely influential. But EDA (1977 the orange book) had almost no impact at all. The immediate reason was that by 1977 the subject had been spread through about 3 editions of the mimeo version and through the efforts of a large number of his students and his colleagues, to most of the statistical world.
A secondary reason is that while JWT was a genius in many ways, he was less successful as an expositor, and it was IMHO the students and other apostles who spread the gospel successfully. It was not the only time in statistics that this sort of thing happened. Sam Wilks’ Math Stat notes from 1943 had a large impact; the 1962 Wiley book died a sudden death. The reasons behind the two cases were very different. Of course this doesn’t matter, even if true, except that the current generation may think you refer to the book, and you should make clear that it is the subject.
Most of us agree with Stigler’s assessment that the greatest impact arose from the enthusiastic welcome of EDA71 among those who analyze data and apply statistics. This was in large part occasioned by the EDA short course presented in 1975 at the American Statistical Association meetings in Atlanta, the first ever ASA-sponsored such course.
John Chambers gives a similar assessment of the direct assessment of the impact of EDA77:
This depends on what you mean by EDA, but I’ll take it to refer to the 1977 book and various versions and elaborations of similar techniques.
The answer is “Not much, directly” but more importantly, what did Tukey’s overall approach to data analysis have? Profound, inspirational really.
For Peter Huber :
Tukey’s 1962 paper is crucial, his 1977 book detracts from its import by putting too much emphasis on the “E” [in EDA] and neglecting the interplay of exploration and aspects such as modeling.
Software
The practical power of a statistical test is the product of its statistical power and the probability of use. — Tukey (1959)

Although part of the charm of EDA was its use of simple paper and pencil methods (starting with how to count, using dot-and-line marks to tally by tens and how to display data values with stem-leaf plots), additional appeal arose from the development of software systems that made EDA methods more accessible (as in the quote on practical power), and easy to use for larger problems. The influence of EDA on computational methods and graphics here was larger than just translating hand-methods into computer code calls. It influenced and helped popularize a burgeoning trend toward dynamic and interactive software founded on data visualization. As well, over a short period of time, drawing graphics became so much easier with computers, certainly with the Apple Mac in the 1980s. It was not so much that graphics was an important part of EDA because of new graphic methods, it was because it became so easy to draw known graphics and draw many of them.
Looking back on this history, I’m willing to argue that a very large part of the leading-edge development of software for data analysis and data graphics was heavily influenced by Tukey’s philosophy. Software packages, like SPSS and SAS tried to reproduce classical statistical analysis as seen in textbooks: Descriptives, ANOVA, Regression, basic charts, and plots. But, as computing power and software infrastructure developed, so too did the development of novel computing and graphing environments with a large EDA flavor.
The first of these was called SNAP/IEDA, developed by Mike Godfrey (SNAP), David Hoaglin, Gordon Sande (/IEDA), and others at Princeton 1970–1971, and then migrated to MIT by Roy E. Welsch, University of Chicago by David Wallace, and other places (Hoaglin and Welsch 1974). This was written in FORTRAN IV, and compiled on the mainframe IBM 360/91 in the newly built Princeton Computer Center. I recall watching while a “new release” of the package (fixing bugs or adding features) was being loaded into the card readers from two or more trays of punched cards. In those days, long before GitHub, some of us served as “beta testers” for new features and also used the software to check some of Tukey’s examples and assignments.
Paul Velleman remembers a more direct experience:
David Hoaglin handed me the computer cards for the IEDA program the first week I was in Princeton, and I tended that system while I was there. During my first summer, I wrote a BASIC-based Library of EDA routines, some of which later informed the BASIC and Fortran code in ABCs of EDA (Velleman and Hoaglin 2004). A few years later, I contributed the Fortran code to the Minitab system and spent a summer installing it there. That made Minitab the first mainstream program with special EDA capabilities. Ultimately, I developed the Data Desk program, which we continue to develop and distribute. Learning Data Analysis with Data Desk came out of that work, as did the ActivStats introductory statistics e-text.
Shortly later Wainer and Thissen (1977) wrote a simple EXPAK package in Fortran. More importantly, Velleman (1985) developed Data Desk for the Mac, the first widely available software incorporating EDA methods into an interactive, point-and-click interface, still developed and supported today. Concurrently, at ETH Zurich and then Harvard, Peter Huber developed ISP, which he claims as the first system to add and integrate high-interaction graphics (Huber 2011).
Somewhat later, Luke Tierney developed XLISP-Stat (Tierney 1990) offering dynamic graphics, and Forrest Young (Young 1994; Valero-Mora, Young, and Friendly 2003; Young, Valero-Mora, and Friendly 2006) designed ViSta, “A Visual Statistics System”, extending the ideas of “visual” data analysis further, and incorporating methods for multivariate and categorical data that had roots in Tukey’s views of graphical methods. Some of this history is detailed here.
In 1970, when I was a post-doc at Yale (in Cognitive Psychology), I quickly learned that there was only one teletype terminal in the Psychology Building. I often had to wait my turn while another young guy was typing away. He was Lee Wilkinson, who went on to found SYSTAT when he went to the University of Illinois. The important points for the present narrative are that: (a) SYSTAT became widely successful and was later adopted by SPSS as a major component of its product; (b) Lee’s experience with SYSTAT led to the idea of a Grammar of Graphics (GoG) (Wilkinson 1999, 2005), formalizing ideas, nascent in Bertin (1983), for modern computational graphical methods.
Robust methods, smoothing of noisy data, conditioning (trellis) plots and high-dimensional data visualization all derived from Tukey’s philosophy of data analysis. To cite just a few developments:
- John Chambers, Rick Becker and others (Becker and Chambers 1984; Chambers et al. 1983) at Bell Labs created a statistical graphics system using the proprietary S language, which led to R as open software, now the most widely used language for statistical and graphics applications.
- Hadley Wickham’s ggplot2 package (Wickham 2009) for R, a direct descendant of GoG, has become the lingua franca of data graphics and influences nearly all data visualization software today.
- Andreas Buja, Debbie Swayne, also at Bell Labs, developed XGobi (later: GGobi) as an interactive EDA system for high-D data using linked plots, brushing, projection tours in dynamic 2D views, etc. (See: The History of Ggobi) Di Cook recalls:
When I got to the USA, Rutgers, I was enamored by the Sun workstations. Everything could be done on this machine. Linked scatter plots were much more meaningful, and using S to do calculations and modeling in association was really fun. This would have been my first exposure to EDA. This work connected me to Andreas and to Debby Swayne (who maybe should be on this email thread). The work that we then did on XGobi, GGobi, Orca, cranvas, and now various R packages evolved from Andreas’ work on Dataviewer with Werner Stuetzle and John McDonald.
Dataviewer evolved from the Huber branch of robustness. Andreas has several great stories. One being that the first Sun motherboard was excitedly shown to them in the Stanford labs, and their group jumped in to experiment with possibilities for dynamic graphics. Another story relates to LispStat, that Andreas, Werner and John had a nice NSF grant to develop interactive and dynamic data plots, in Symbolic Lisp. Then this young guy (Luke Tierney) from U.Minn showed XLispStat, which made them all feel quite inadequate, because one guy working alone had achieved what they had been promising.
A related European visualization software thread was started by Antony Unwin, mostly at Universitat Augsburg. Unwin’s RoSuDa Lab produced a variety of separate software packages with an EDA flavor, all named after Impressionist painters and designed to be highly interactive: Manet (missing data methods), Cassat (multivariate data using parallel coordinates), Seurat (microarray data), Klimt (tree-based methods), Gauguin (glyph plots), and VanGogh (network methods); meanwhile Mondrian, developed by Martin Theus while at Bell Labs in 1998, extends EDA methods to categorical data, geographical data and handles large data sets (Theus 2002).
Principles and philosophy of EDA
In 1993, Tukey gave a series of three lectures at the University of Maryland, College Park, part of a series in a “Year of Data” program. A written version (Tukey 1993) appeared as a technical report, Exploratory Data analysis: Past, Present, and Future, in which Tukey sketched the past (Part A: 1971–1977), developments from 1991–1994 (Part B), and ideas for the future (Part C: 1995–2005).
Part A is comprised of Tukey’s reflections on the philosophy and techniques of EDA71 and EDA77. It is hard to summarize this succinctly, but some key points were:
- emphasis on seeing results (graphically, or numerically)
- emphasis on simple arithmetic
- emphasis on data = fit + residuals (where the fit is admittedly incomplete)
- emphasis on successively better fits (doing better by moving recognizable structure from residual to fit)
- no appeal to probability, either formal or informal
He illustrated these ideas with discussion and examples of some of the main EDA techniques described in these volumes:
- Stem-and-leaf displays
- simple enough to make them the fastest way to record batches,
- enough detail to use as a basis for almost any desired computation,
- visual impact comparable with a histogram.
- Letter values, 5-number summaries and schematic plots
- Summarizing a “batch” needs to be better than just one number (mean, median),
- Order statistics (quantiles, median, extremes) give more detail
- “Fences” define extreme data values worthy of attention,
- A schematic plot (later: box plot) shows the main characteristics of interest: center, spread, asymmetry, outliers.
- Re-expression
- Ladder of powers
- Straightening curves
- Two-way tables
- fit = row + column; two-way plot
- diagnostic plot for removable non-additivity
Yet as mentioned earlier, EDA is more of an attitude or philosophy of data analysis than a toolbox of techniques. Some years earlier Hoaglin, Mosteller, and Tukey (1983) in UREDA identified what they considered the 4Rs of EDA themes and practice: Resistance, Residuals, Re-expression, Revelation.
- Resistance: insensitivity to wild observations or outliers. From the simple EDA idea that medians and quartiles were more satisfying than means and standard deviations in the presence of outliers, the more general idea of robust estimation was studied intensely in the Princeton robustness study (Andrews et al. 1972; Huber 1972). Recognizing that normal distributions were often the exception rather than rule, robust estimation came to be applied to classical methods (linear models, multivariate analysis, etc.). (The idea of robustness—insensitivity to assumptions of a method—goes back to George E.P. Box around 1953. See Stigler (2010) for a brief history of these ideas and methods.)
- Residuals: the idea that fitting some model was always a “partial summary”. What was still unexplained—and a source for discovery—was contained in the residuals (= data – fit) part.
- Re-expression: In a variety of applications, Tukey illustrated how a transformation of data, to √y=y^(1/2), or log(y)≈y^0, or 1/y=y^(-1 ), simplified an analysis by making distributions more symmetric or relationships more linear or ANOVA models more additive or of more constant residual variance. The idea of a “ladder of powers” (going back to Tukey (1957 )) brought simple regularity to transformations:
- univariate – go up or down the scale of powers to pull in the tail;
- bivariate – the bulging rule: follow the arrow to suggest a transformation of x or y or both.
- Revelation became a big selling point of the graphical approach of EDA. The idea of making graphs was promoted from post-hoc, model-based summaries, to an important tool in visual discovery.
Attitudes and aphorisms
In addition to the techniques and general principles of data analysis noted above, it can be said that what excited interest and attracted attention to EDA—as a philosophy and practice of data analysis—was a collection of attitudes, often expressed in pithy aphorisms and concrete analogies.
Tukey’s writing and teaching style often seemed somewhat on the oblique side. Indeed, some mathematical statisticians wondered whether he wasn’t being deliberately obscure. But many others were energized by what seemed to be simple revelations, the inspirations of a great master, left to them to interpret. In the following we use a few quotes as a framework for these attitudes of EDA.
Visual thinking
If one technique of data analysis were to be exalted above all others for its ability to be revealing to the mind in connection with each of many different models, there is little doubt which one would be chosen. The simple graph has brought more information to the data analyst’s mind than any other device. It specializes in providing indications of unexpected phenomena. — John W. Tukey (1962), p. 49
In our survey of the history of data visualization (Friendly and Wainer 2021) one key organizing idea arose loud and clear: how, in human history, graphic representation of data reflected a developing cognitive ability for visual thinking and a corresponding visual language for making abstract ideas concrete. Tukey excelled at visual thinking, both in his applied work and his proselytizing.
This was not a new idea. But except for popularizers of the “graphic method” (Brinton 1914), it had been forgotten by statisticians in the first half of the 20th Century. In this period, statisticians were largely inclined toward tables, numbers, and p-values, which could be made precise.
Amongst the earliest modern proponents of the power of graphical representation was William Playfair, who, in a few short years, invented the mainstays of simple modern graphical methods: the line chart, bar chart and pie charts. In Playfair’s Statistical Breviary (1801), we find among the first explicit statements of data graphs “speaking to the eye”.
To give insight to statistical information it occurred to me that making an appeal to the eye when proportion and magnitude are concerned, is the best and readiest method of conveying a distinct idea. — William Playfair (1801), p. 2
Charles Joseph Minard (1861) expressed a similar idea:
The aim of my carte figurative is to convey promptly to the eye the relation not given quickly by numbers requiring mental calculation.
Tukey did not appeal to history in seeking illustrations of the role of visualization in scientific discovery. Amongst the most prominent examples are Francis Galton’s discovery of regression and his discovery of weather patterns in Europe, both achieved through graphical analysis (and smoothing) of data (Friendly and Wainer 2020).
The power of graphs
Tukey extolled the power of well-constructed graphs for going far beyond what could be discerned from numerical summaries. He also called attention to the relative roles of numbers and pictures in data analysis
The greatest possibilities of visual display lie in vividness and inescapability of the intended message. A visual display can stop your mental flow in its tracks and make you think. A visual display can force you to notice what you never expected to see. — Tukey (1990), p. 367
The purpose of [data] display is comparison (recognition of phenomena), not numbers … The phenomena are the main actors, numbers are the supporting cast. — Tukey (1990)
The main tasks of pictures are then:
- to reveal the unexpected ,
- to make the complex easier to perceive. — Tukey (1975)
Perhaps more importantly, in many of his methods and examples, Tukey developed the idea of the impact of a graph: how well it shows the phenomenon or aspect of interest to the viewer. Today, this idea is sometimes called the intraocular trauma test: “you know what a graph means when the conclusion hits you between the eyes.” (The IOT term is attributed to Joseph Berkson, ~ July 1958. It first appeared in print in 1963 in Edwards, Lindman, and Savage (1963) where they cite it as a “personal communication”.)
Another important aspect of impact is immediacy. One should see the intended at once; one should not even have to wait for it to gradually appear. If a visual display lacks immediacy in thrusting before us one of the phenomena for whose presentation it had been assigned responsibility, we ought to ask why and use the answer to modify the display so its impact will be more immediate. — Tukey (1990) p. 328
Graphical “impact” was an idea more related to perceptual and cognitive psychology than to statistics, but graphical perception had not been extensively studied at this time. Impact entailed the capability of a graph to enforce attention to the the most important message. This idea was central to a number of Tukey’s graphical ideas and innovations. Among these were the principles that:
- Graphical comparison of data to a theoretical description is best made where the theory plots as a straight line, hopefully horizontal. Some examples are:
- Plotting residuals from a linear model vs. fitted values.
- De-trending a quantile-quantile plot so that the reference line is horizontal
- Hanging rootograms showing observed & theoretical frequencies, but ‘hanging’ the observed values from the theoretical curve, so that the discrepancies are seen by comparison with the horizontal axis rather than a sloping curve.
Whatever the data, we can try to gain by straightening or by flattening. When we succeed in one or both, we almost always see more clearly what is going on. —EDA77, p. 148.
- Re-expression of data variables often made complex relations simpler. The idea of the ladder of powers made transformations understandable, but did much more.
- In linear regression, a transformation of y or x that straightened a relationship often made residuals more nearly symmetric.
- In ANOVA models, a transformation that reduced non-normality or heterogeneity of variances of residuals often reduced the need for interaction terms.
EDA: detective work versus CDA: judicial process
Even in 1962, Tukey recognized that he had to frame his approach as a new style of data analysis. Just like my old watch with moving hands had to be re-branded as an “analog watch” once digital watches became the norm, the rise of EDA occasioned a reconceptualization of the classical, significance testing view of data analysis as Confirmatory Data Analysis (CDA). An older view distinguished between descriptive and inferential statistics, but EDA vs. CDA was what Tukey had in mind, both being brands of data analysis.
On the first page of EDA77, he proclaimed, “Exploratory data analysis is detective work”, and went on to distinguish the role of the detective in discovering clues and indications vs. that of the jury in an Anglo-Saxon trial where the goal was to come to a guilty – not-guilty decision to a reasonably strict standard.
To many in those days, EDA seemed an eminently respectable and admirable avocation, not to be tarnished as data “fishing” or “torturing” the data set until it confesses. In continuing the analogy of detective work vs. judicial process, he was always clear to say that both were needed:
Exploratory data analysis can never be the whole story, but nothing else can serve as the foundation stone—as the first step – Tukey (1977), p. 3.
In 1968, Tukey gave an invited address to the annual meeting of the American Psychological Association, titled “Analyzing Data: Sanctification or Detective Work? (Tukey 1969) He ends this with the clearest statement of the complementary goals and differences:
What ought to be the nature of data analysis? Data analysis needs to be both exploratory and confirmatory. In exploratory data analysis there can be no substitute for flexibility, for adapting what is calculated—and, we hope, plotted—both to the needs of the situation and the clues that the data have already provided. In this mode, data analysis is detective work—almost an ideal example of seeking what might be relevant.
Confirmatory data analysis has its place, too. Well used, its importance may even equal that of exploratory data analysis. We dare not, however, let it be an imprimatur or a testimony of infallibility. “Not a high priestess but a handmaiden” must be our demand. Confirmatory data analysis must be the means by which we adjust optimism and pessimism, not only ours but those of our readers. To do this is not easy and may require new approaches and unfamiliar ways of thinking. — Tukey (1969), p. 90.
Genealogy of EDA
It is of some interest to try to visualize the spread of EDA ideas and related methods through genealogies of advisors and their students who figured in this development, even if a simple graph omits some important connections and includes some not strictly germane to this story.
Figure 3 shows a network of advisor—student relations. The main portion of this centers on John Tukey at Princeton and his students who went to Harvard (Fred Mosteller, but officially a student of Samuel Wilks) and Yale (John Hartigan), and also some of their descendents. This figure is only meant to be suggestive—of paths in the spread of influence of EDA ideas and methods. According to the Mathematics Genealogy Project, John Tukey had 57 students and 1751 descendants. The Mosteller branch is listed with 9 students and 331 descendants.

Several other family histories are shown here, although incompletely. The Princeton Psychology department was home to the Psychometric Fellowship program, directed by Harold Gulliksen, and sponsored by Educational Testing Service. Bert Green, an early psychometric fellow became involved with Tukey (Green and Tukey 1960) on the analysis of a complex 6-way ANOVA-like table that led to FUNOR and FUNOP and other insights Tukey described in 1962 and the EDA approach to analysis of two-way tables based on robust methods (median fitting) and graphical display of fitted values and residuals. Several later psychometrics students caught the EDA bug and became advocates of this approach to data analysis and visualization.
Tukey was also associated with Bell Laboratories in Murray Hill, NJ, where there was an active group of applied statisticians including some working on multidimensional scaling, hierarchical cluster analysis, … (Joseph Kruskal, Steven Johnson, Douglas Carroll and others). Among many of these links, Andreas Buja arrived there as a student of Peter Huber, and went on to foster his own line including Dianne Cook and through her, Hadley Wickham.
Bill Eddy recalls:
An important part of the 1970-1971 story is not really about EDA but rather about robustness. I was prompted by remembering that Tukey always referred to Peter B (Bickel) and Peter H (Huber) from those days..
Memories, recollections, influences: commentaries by those involved
The following selected comments from respondents to my questions are given here. They add some details on the connections among EDA disciples, influences and attitudes formed in the early years of the EDA movement.
Lee Wilkinson, 7/3/2020 6:49pm
Most of all, reflecting Steve’s observation, Abelson as a Tukey disciple introduced us to a whole new way of thinking about data. This included things like Luce and Tukey’s conjoint measurement, which some psychologists and marketing methodologists jammed back into their favorite ANOVA straight-jacket and thereby completely misunderstood the original idea. Abelson had us run MONANOVA instead of SPSS and we learned how scaling affects the behavior of factorial models. He encouraged me to bring back from the 1972 Bell-Penn workshop the tape of all the Bell Labs programs. I installed it at the Yale Computer Center and used it for my dissertation.
Tukey was not a great writer. But he was a great thinker. Many of you may object, but I regard most of your writing as superior to Tukey’s. His staccato style and neologisms made it difficult for some readers to follow his arguments. Like Shakespeare, Tukey invented a ton of words that are now in the general vocabulary. But in the 1970s, they weren’t. And, as you know, he was a genius at getting people to think — often with the raising of an eyebrow rather than a long monologue.
What further changed my life was walking up the street and sitting in on John Hartigan’s clustering course. John cared about students. And he made us aware that clustering wasn’t simply a taxonomic method. Like Tukey, Luce, Kruskal, Shepard, and other great thinkers, John helped us to understand that similarities and differences underlay almost all data analysis. To know something is to know in what ways it is similar to and different from other things you know.
John D. Emerson, 7/3/2020 7:56pm
In the summers of 1976 and 1977 I participated in an NIH program that turned many people like me into applied statisticians. The emphasis was on biostatistics, and at the time Fred Mosteller was chairing the biostatistics department at Harvard School of Public Health. I attended a Mosteller and Tukey ASA Short Course on EDA at the Joint Meetings (California) in August 1978; when John got tired, Fred took over, and it was an impressively steady pace for a couple of days with a huge audience. …
For some of us, Tukey’s seminal work seemed to have a certain “black box” quality. Unlike the main focus of his work in the 60s and 70s, the Cambridge group addressed questions like “Why?” and “What’s really going on here?”. We were at least as much interested in questions of robustness as in the EDA techniques, and of course we appreciated that the EDA procedures benefited from inherent robustness.
My comments don’t relate directly to the origins of EDA and to JWT as other comments do, so I’ll make some other connections. Two of my early students, Kathy Bell Krystinik and Kathy Hanson, went on to get PhDs with John Tukey. My son, Jay (Yale faculty) and my daughter-in-law, Alex Thiry, are both doctoral students of John Hartigan — thus “grandchildren” of Tukey. That makes me the father and father-in-law of two of Tukey’s grandchildren. In 1977, little could I have imagined this when I sent my very first thesis student, Kathy Bell, off to Princeton to work with Tukey, even before I had met Fred Mosteller.
Richard Heiberger, 7/4/2020 12:39am
My initial connection to EDA is from David Hoaglin’s course at Harvard in 1970-1971 with the limited preliminary edition. I was deeply into the APL language at the time (it is the language in which I did the computations for my dissertation) and translated many of the EDA algorithms into APL.
Later I did joint work with Paul Velleman and looked over his shoulder as he was writing “LEDA and the Swan” and DataDesk.
I taught courses at Penn from the limited preliminary edition of EDA and then from the Orange book. As others have noted, Tukey’s ideas were brilliant. And at the same time a reader needed guidance from a first-level student or colleague of Tukey’s for the ideas to be fully understood. The sequence of books by Tukey, then Tukey and Mosteller, and then Hoaglin, Tukey, and Mosteller, made the ideas both more readable and also more rigorous in their presentation.
I was fortunate to spend a research leave at Bell Labs with the Statistics Group, which reported through John Tukey, and participated in the design of the lm and aov functions in S and R, and the rreg (robust regression) function in S and S+.
It may be of some interest to see a word cloud representing the ideas, topics and people reflected in this email discussion (Figure 4). “EDA” of course is central, but other terms give a sense of the topics.

The Influence of EDA
Looking back, an assessment of the impact of Tukey’s ideas to re-conceptualize the domain “statistics” as “data analysis” should be seen as the central and lasting contribution of what I’ve called EDA here. EDA re-defined the mathematical, formal boundaries, and first-class problems of statistical thinking into data analysis thinking, where graphical methods became respectable, or even sexy.
Moreover, the clarion call, “Far better an approximate answer to the right question which is often vague, than an exact answer to the wrong question, which can always be made precise,” helped free statistical practice and teaching from the orthodoxy of classical statistics.
Two related EDA-inspired developments deserve mention here:
- The thread of robustness studies was directly inspired by EDA, but spawned new areas of inquiry and methods far beyond the methods of EDA. Some examples: influence functions, M-estimators, high-breakdown bound MCD and MVE covariance estimators.
- As hardware and software for data visualization advanced, new high-D methods were developed by those inspired by EDA. An early demonstration of these ideas was PRIM-9 (Fisherkeller, Friedman, and Tukey 1974) which introduced some central methods in dynamic, interactive graphics: Picturing, Rotation, Isolation and Masking. Friedman and Stuetzle (2002) gave an appreciation of these ideas …
John’s work on Prim-9 and Projection Pursuit lent respectability to computationally oriented, non mathematical research in Statistics. He moved the center of gravity away from an (over)emphasis on mathematical theory to a greater balance between methodology, theory, and applications and thereby helped revitalize the discipline of Statistics.
PRIM-9, developed at the Stanford Linear Accelerator Center (SLAC) in early 1972, was the first program to offer interactive, dynamic graphics for viewing and exploring multivariate data (in up to 9 dimensions). (Peter Huber recounts that ideas for PRIM -9 likely came from work his wife Effi did in 1970–71 in Robert Langridge’s molecular biology lab at Princeton (Langridge 1974) using a PDP-10 computer and an Evans & Sutherland LDS Linear Display System.) The first scientific use from PRIM-9 came from Reaven and Miller (1979), who discovered a latent distinction between two classes of type II diabetics based on visual exploration of high-D blood sugar and insulin measurements. As noted earlier, many developments of computer visualization methods and software can be traced to EDA seeds planted by Tukey and others.
More widely, the advent of PRIM-9 and interactive, dynamic graphics could be framed as problems calling for new research methods in human-computer interaction, which arose slightly later as a multi-disciplinary field encompassing computer science, human factors engineering and cognitive psychology.
Finally, for those of us who were teaching “statistics” courses in the 1970s–90s, the EDA perspective and methods provided a new way to conceptualize the topic as structured topics in discovery of phenomena in data, rather than as a collection of formulas and named hypothesis tests. Some of this trickled down to the K-12 curriculum, were used in high school statistics or AP courses, and examples of EDA applications by students in lower grades showed up early in the annual ASA poster competitions.
Unindicted co-conspirators
I am grateful to the following Tukey Disciples who provided their memories of the rise of EDA and some assessment of its’ influence on data analysis and visualization: Andreas Buja, John Chambers, William Cleveland, Dianne Cook, David L Donoho, William F. Eddy, Jay Emerson, John D. Emerson, Michael Greenacre, Richard M. Heiberger, David Hoaglin, Peter Huber, Karen Kafadar, John McCarthy, Andy Siegel, Stephen Stigler, Luke Tierney, David Thissen, Paul Velleman, Howard Wainer, Antony Unwin, Hadley Wickham, Leland Wilkinson. Dave Hoaglin, Antony Unwin, Paul Velleman, and others provided extensive comments on earlier drafts, for which I am deeply thankful.
References
Andrews, D. F., P. J. Bickel, F. R. Hampel, P. J. Huber, W. H. Rogers, and J. W. Tukey. 1972. Robust Estimates of Location: Survey and Advances. Princeton University Press. http://www.jstor.org/stable/j.ctt13x12sw.
Bayes, Thomas. 1763. “Essay Towards Solving a Problem in the Doctrine of Chances.” Philosophical Transactions 53: 370–418. http://www.jstor.org/cgi-bin/jstor/viewitem/02607085/ap000041/00a00520/0.
Becker, Richard A., and J. M. Chambers. 1984. An Interactive Environment for Data Analysis and Graphics. Bellmont, CA: Wadsworth.
Bertin, J. 1983. Semiology of Graphics. Madison, WI: University of Wisconsin Press.
Brillinger, David R. 2002. “John W. Tukey: His Life and Professional Contributions.” Annals of Statistics 30 (6): 1535–75. https://doi.org/10.1214/aos/1043351246.
Brinton, Willard C. 1914. Graphic Methods for Presenting Facts. New York: The Engineering Magazine Company.
Chambers, J. M., W. S. Cleveland, B. Kleiner, and P. A. Tukey. 1983. Graphical Methods for Data Analysis. Belmont, CA: Wadsworth.
Chomsky, Noam. 1957. Syntactic Structures. The Hague: Mouton; Co.
Cleveland, William S., ed. 1988. The Collected Works of John W. Tukey: Graphics, 1965–1985. Vol. V. Chapman; Hall/CRC.
Edwards, Ward, Harold R. Lindman, and Leonard J. Savage. 1963. “Bayesian Statistical Inference for Psychological Research.” Psychological Review 70 (3): 193–242.
Fisherkeller, M. A., J. H. Friedman, and John W. Tukey. 1974. “PRIM-9: An Interactive Multidimensional Data Display and Analysis System.” SLAC-PUB-1408. Stanford, CA: Stanford Linear Accelerator Center.
Friedman, Jerome H., and Werner Stuetzle. 2002. “John W. Tukey’s Work on Interactive Graphics.” The Annals of Statistics 30 (6): 1629–39. http://www.jstor.org/stable/1558733.
Friendly, Michael. 2007. “A Brief History of Data Visualization.” In Handbook of Computational Statistics: Data Visualization, edited by C. Chen, Wolfgang Härdle, and Antony Unwin, III:1–34. Heidelberg: Springer-Verlag.
Friendly, Michael, and Dan Denis. 2001. “The Roots and Branches of Statistical Graphics.” Journal de La Société Française de Statistique 141 (4): 51–60. http://www.numdam.org/item/JSFS_2000__141_4_51_0.pdf.
Friendly, Michael, and Richard M. Heiberger. 2020. Twoway: Analysis of Two-Way Tables. https://CRAN.R-project.org/package=twoway.
Friendly, Michael, and Howard Wainer. 2020. “Galton’s Gleam: Visual Thinking & Graphic Discoveries.” Significance 17 (3): 28–32. https://doi.org/10.1111/1740-9713.01403.
———. 2021. A History of Data Visualization and Graphic Communication. Cambridge, MA: Harvard University Press. https://doi.org/10.4159/9780674259034.
Green, Bert F. Jr., and John W. Tukey. 1960. “Complex Analyses of Variance: General Problems.” Psychometrika 25: 127–52. https://doi.org/10.1007/BF02288577.
Hoaglin, David C. 2003. “John W. Tukey and Data Analysis.” Statistical Science 18 (3): 311–18. https://doi.org/10.1214/ss/1076102418.
Hoaglin, David C., Frederick Mosteller, and John W. Tukey, eds. 1983. Understanding Robust and Exploratory Data Analysis. New York: John Wiley; Sons.
———, eds. 1985. Exploring Data Tables, Trends and Shapes. New York: John Wiley; Sons.
Hoaglin, David C., and Roy E. Welsch. 1974. “MIT-SNAP, an Interactive Data Analysis System.” Boston, MA: Sloan School of Management, MIT.
Huber, Peter J. 1972. “Robust Statistics: A Review.” Annals of Mathematical Statistics 43: 1041–67.
———. 2011. Data Analysis : What Can Be Learned from the Past 50 Years. Wiley-Interscience .
Jones, Lyle V., ed. 1986a. The Collected Works of John W. Tukey: Philosophy and Principles of Data Analysis, 1949–1964. Vol. III. Taylor & Francis. https://books.google.ca/books?id=C1guHWTlVVoC.
———, ed. 1986b. The Collected Works of John W. Tukey: Philosophy and Principles of Data Analysis, 1965–1986. Vol. IV. Taylor & Francis.
Kuhn, Thomas S. 1970. The Structure of Scientific Revolutions. Chicago: University of Chicago Press.
Langridge, Robert. 1974. “Interactive Three-Dimensional Computer Graphics in Molecular Biology .” In Computers in Life Science Research, edited by Lindberg Siler W., 2:53–59. Boston, MA: Springer US. https://doi.org/10.1007/978-1-4757-0546-1_10.
McCullagh, Peter. 2003. “John Wilder Tukey 16 June 1915–26 July 2000.” Biographical Memoirs of Fellows of the Royal Society 49: 537–55. http://www.jstor.org/stable/3650242.
Miller, George. 1956. “The Magical Number Seven, Plus or Minus Two: Some Limits on Our Capacity for Processing Information.” The Psychological Review. http://cogprints.org/730/.
Minard, Charles Joseph. 1861. Des Tableaux Graphiques Et Des Cartes Figuratives. Paris: E. Thunot et Cie.
Mosteller, Frederick, and John W. Tukey. 1968. “Data Analysis, Including Statistics.” In Handbook of Social Psychology, Vol. 2, edited by G. Lindzey and E. Aronson, 2nd ed., 80–203. Addison-Wesley.
———. 1977. Data Analysis and Regression: A Second Course in Statistics. Reading: Addison-Wesley.
Newell, A., J. C. Shaw, and H. A. Simon. 1958. “Elements of a Theory of Human Problem Solving.” Psychological Review 65 (3): 151–66. https://doi.org/10.1037/h0048495.
Playfair, William. 1801. Statistical Breviary; Shewing, on a Principle Entirely New, the Resources of Every State and Kingdom in Europe. London: Wallis.
Reaven, G. M., and R. G. Miller. 1979. “An Attempt to Define the Nature of Chemical Diabetes Using a Multidimensional Analysis.” Diabetologia 16: 17–24.
Stigler, Stephen M. 2010. “The Changing History of Robustness.” The American Statistician 64 (4): 277–81. https://doi.org/10.1198/tast.2010.10159.
Theus, Martin. 2002. “Interactive Data Visualization Using Mondrian.” Journal of Statistical Software 7 (2). http://www.jstatsoft.org/v07/i11/.
Tierney, Luke. 1990. LISP-STAT: An Object-Oriented Environment for Statistical Computing and Dynamic Graphics. New York: John Wiley; Sons.
Tukey, John W. 1957. “On the Comparative Anatomy of Transformations.” The Annals of Mathematical Statistics 28 (3): 602–32. http://www.jstor.org/stable/2237223.
———. 1959. “A Quick, Compact, Two Sample Test to Duckworth’s Specifications.” Technometrics 1: 31–48. https://doi.org/10.2307/1266308 .
———. 1962. “The Future of Data Analysis.” The Annals of Mathematical Statistics 33 (1): 1–67. http://www.jstor.org/stable/2237638.
———. 1969. “Analyzing Data: Sanctification or Detective Work?” American Psychologist 24 (2): 83–91. https://doi.org/10.1037/h0027108.
———. 1970a. Exploratory Data Analysis. Limited preliminary edition. Vol. 1. Reading, MA: Addison-Wesley.
———. 1970b. Exploratory Data Analysis. Limited preliminary edition. Vol. 2. Reading, MA: Addison-Wesley.
———. 1971. Exploratory Data Analysis. Limited preliminary edition. Vol. 3. Reading, MA: Addison-Wesley.
———. 1975. “Mathematics and the Picturing of Data.” In Proceedings of the International Congress of Mathematicians, Vancouver, 2:523–31.
———. 1977. Exploratory Data Analysis. Reading, MA: Addison Wesley.
———. 1990. “Data-Based Graphics: Visual Display in the Decades to Come.” Statistical Science 5 (3): 327–39.
———. 1993. “Exploratory Data Analysis: Past, Present, and Future.” No. 302. Department of Statistics, Princeton University. https://apps.dtic.mil/dtic/tr/fulltext/u2/a266775.pdf.
Tukey, John W., and P. A. Tukey. 1985. “Computer Graphics and Exploratory Data Analysis: An Introduction.” In Proceedings of the Sixth Annual Conference and Exposition: Computer Graphics85, III:773–85. Fairfax, VA: National Computer Graphics Association.
Valero-Mora, Pedro M., Forrest W. Young, and Michael Friendly. 2003. “Visualizing Categorical Data in ViSta.” Computational Statistics & Data Analysis 43 (4): 495–508.
Velleman, Paul F., and David C. Hoaglin. 2004. Applications, Basics, and Computing of Exploratory Data Analysis. Boston, MA: Duxbury Press.
Velleman, Paul F., and A. Y. Velleman. 1985. Data Desk Handbook. Ithaca, NY: Data Description.
Wainer, Howard, and David Thissen. 1977. “EXPAK: A FORTRAN IV Program for Exploratory Data Analysis.” Applied Psychological Measurement 1: 49–50.
Wickham, Hadley. 2009. Ggplot2: Elegant Graphics for Data Analysis. Springer New York. http://had.co.nz/ggplot2/book.
———. 2014. “Tidy Data.” Journal of Statistical Software 59 (10): 1–23. https://doi.org/10.18637/jss.v059.i10.
Wilkinson, Leland. 1999. The Grammar of Graphics. New York: Springer.
———. 2005. The Grammar of Graphics. 2nd ed. New York: Springer.
Young, Forrest W. 1994. “ViSta: The Visual Statistics System.” RM 94-1. L.L. Thurstone Psychometric Laboratory, UNC.Young, Forrest W., Pedro Valero-Mora, and Michael Friendly. 2006. Visual Statistics: Seeing Data with Dynamic Interactive Graphics. Hoboken, NJ: Wiley-Interscience.
Developer of graphical methods for categorical and multivariate data and the Milestones Project on the history of data visualization http://datavis.ca
- Michael Friendly

- Michael Friendly

- Michael Friendly


