
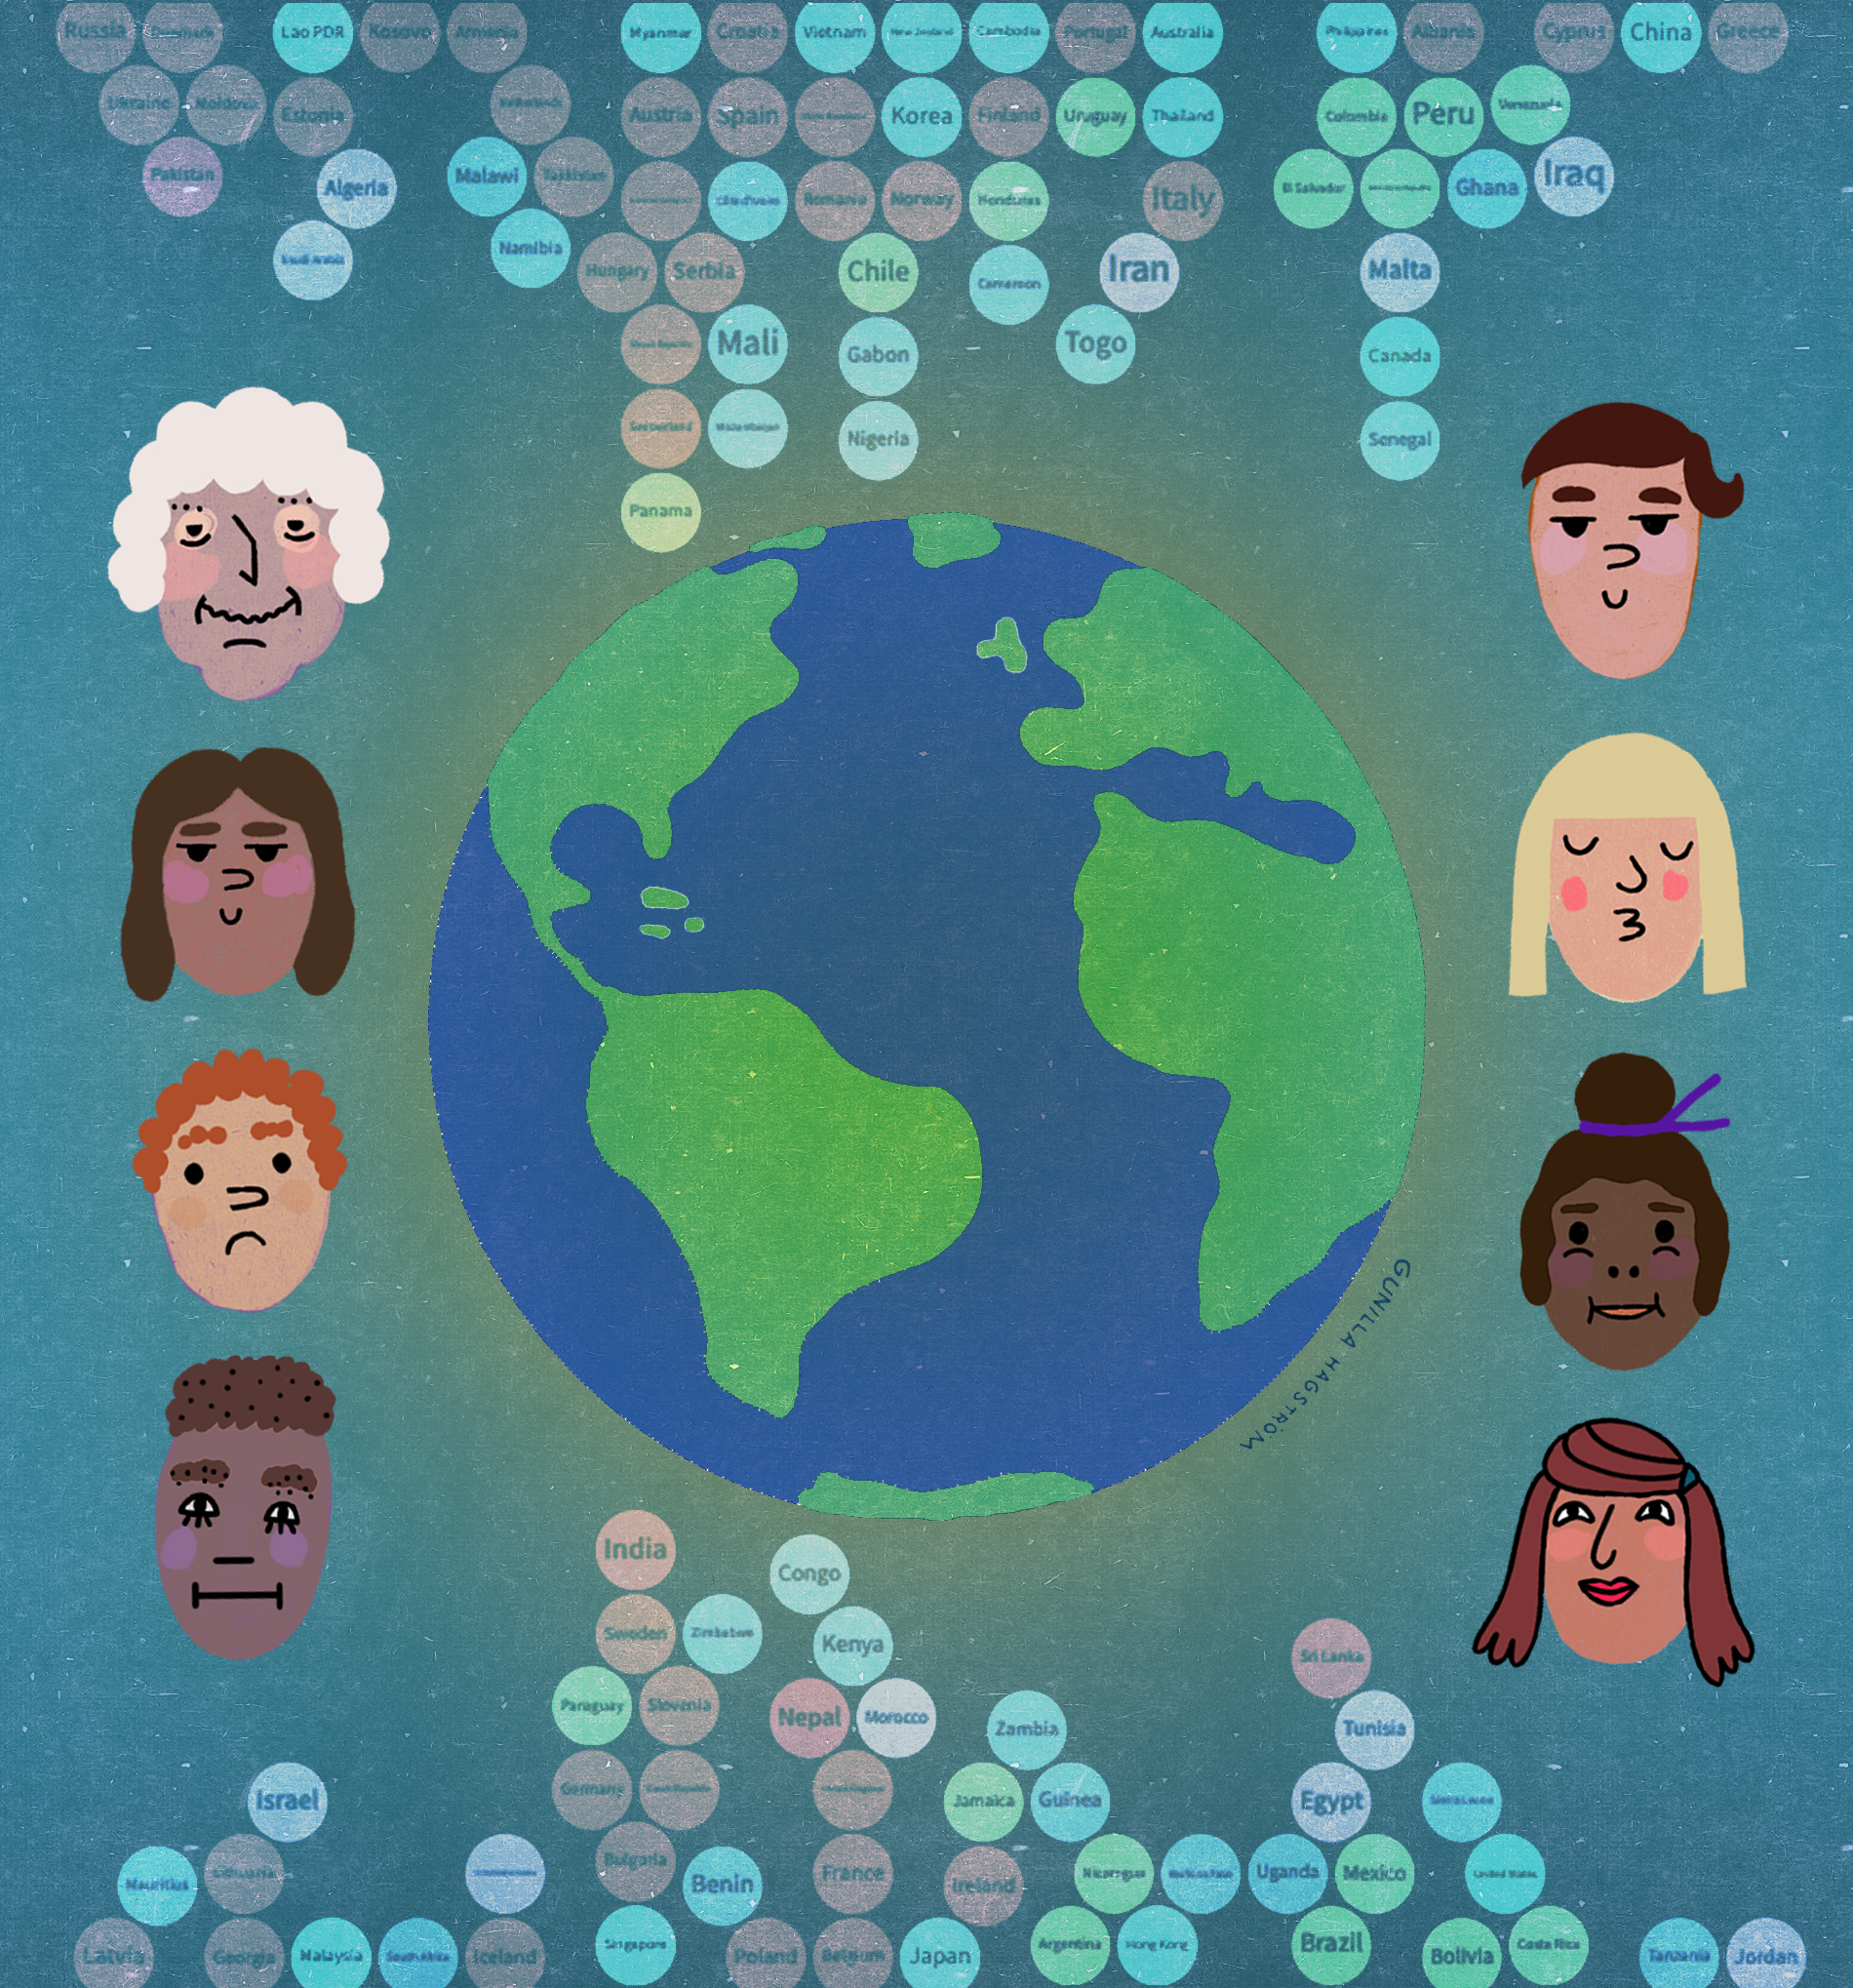
To discover people’s emotional states worldwide, Gallup conducted a research project that surveyed hundreds of thousands of people about the feelings they experienced over a year. The findings offered surprising insights.
How do you tell an engaging story about a survey to a global audience? Instead of telling, I challenged the readers to find out themselves using a quiz.
Using a personalised quiz, I invited readers to compare their experiences with others in their country – and their country with the rest of the world.
Following the quiz, I used the scrollytelling technique to visualise some of the key findings of the survey. Simultaneously, I guided the users to learn to explore further – which they could at the end of the story.

Method and tools
The survey data is from Gallup’s World Happiness Report. I selected five of the ten emotions to avoid repetition. For the last quiz question –which required comparing countries– I simply ordered and grouped the data in Excel. While this question is less intuitive than the previous questions, it was aimed to be a segue from exploring one country to exploring all countries in the scrollytelling that followed.
I used Flourish to create the quiz and the other charts. I created the scrollytelling part using the combination of the Flourish stories feature and Scrollama JavaScript library from The Pudding.
Conclusion
Thus, I aimed to engage the readers with survey data and explained a story about people’s emotional states using four interactivity techniques: personalisation, gamification, scrollytelling, and exploration.
This story was also featured in Global Investigative Journalism Network’s Top 10 Data Journalism weekly list. You can find the story here.
Karthik Muthuswamy is a freelance data journalist and a software developer based in Stockholm. He is a lifelong learner and has a passion for writing. After working in tech for a decade, he recently studied for a Master’s in Data journalism to explore the possibilities of using technology in storytelling.
He now creates interactive visual stories using his skills in storytelling and technology.
- Karthik Muthuswamy


