
Interactive data in the pre-Web era
Interactive data visualization is an essential component in the current state of our web. But like everything else, it must evolve to keep pace with technological and societal progress. As our world becomes increasingly data-driven and technologies like AI, the Metaverse, and the decentralized web gain momentum, pushing interactive data visualization to the next level is crucial. In this article, we explore the drivers of the evolution of interactive data visualization over the past decades and the challenges ahead.
Introduction
As humans, we have always had the urge to chart the world around us. This urge has pushed us to improve the way we collect, process, and communicate information throughout history.
Our progress on building and implementing more structured methods over the last centuries allows us to distill patterns and trends much better as our data collections keep growing. We can see this, for example, in the structured long-term weather data collected since as far back as 1657. Eventually, consistent weather tracking evolved into how we record temperatures since 1880, data we still use today, enabling us to visualize global temperature changes over time.

Technological advancements have undoubtedly contributed to improved quality of data recording, analysis, and presentation. Particularly nowadays, in the information age, where the web had a great impact on how we create, process, consume, and interact with data. These developments now allow us to gain, with the help of data, better knowledge and wisdom about our universe, planet, society, and ourselves.
Over the course of time, different developments and influences –from technological to user research advancements– have brought us to today’s state of online interactive data visualization. To understand this, we have to go back to the development of Atari, Apple, and Personal Computers in the 1970s.
PART 1 — Interactive data in the pre-Web era
before 1994

The start of digital information
It was back in the seventies when information was starting to leave books, press, and television, and moving into Personal Computers in the offices and homes of those who had the money, time and skills to own and operate them. Those early domestic machines, even if with great potential, still lacked usability and were restricted to a relatively small global community.

Limited data
During this period, technological development was promising and exciting. However, most data was only locally stored and not accessible to the general public unless (occasionally) translated to existing communication channels, like newspapers and tv shows.
Exploring navigation
Hardware-wise, this was the time when exploration of how we humans can interact with the computer and the data it can present was taking place. First attempts of touchscreens, joysticks, and input tablets were developed, built, and tested in business, educational, and research fields.

Complex software
The first attempts at interactive data visualizations were created in university settings, leading to the first full-color computer graphics. Working with these, however, required solid expertise in how to code them.
Software was developed with experts on specific sectors in mind, and therefore the user base was limited. By this time, the focus was on advancing technology, not thinking much of usability, and the questioning of the ethics of software was barely acknowledged by society.

New ways of interaction
As it kept evolving, more sophisticated software required new ways of interacting with computers. As demoed in 1968, we started using more and more basic mouse behavior like pointing, clicking, and scrolling. These turned out to be great ways of interacting with data and other information on screens, but the hardware this required (e.g. mouse) was not commonly used yet.

Easier to use software
The development of easier-to-use specialized software meant that we could not only work with text and digits, but we could also work with graphics. We started using computers for data visualization thanks to the charting software first released in the late 70s and beginning of the 80s, such as VisiCalc, Matlab, and Lotus 1–2–3. These tools still required training to be able to use them properly, though this became acceptable for the first group of educational, business, and even home users.

Hard to share
The amount of digital information started growing considerably. However, even if we found ways of building and manipulating digital information, sharing it was still restricted in most parts of the physical world (we either printed it or stored it in drives that we could then carry to other computers).

Our future visions back then
By the 1980s, the possibilities and rapid advancement of technology made us dream. The idea of interactive screens and smart boards that would allow us to touch and use speech to interact with data visualization and other graphic information felt more physical and human than using a cursor on a screen, and seemed like a possible achievement in a matter of a decade or two.
1988 future vision
This video shows how Apple envisioned how people could use the computer in the year 2000:
There was a big desire to not just consume content but also have the ability to access the underlying data and sources.
The potential of computers felt even too restricted when compared to futures described in novels and movies like Tron, which were suggesting us gateways into the actual digital world and interactions with virtual intelligences.

Growth of users
We successfully pushed and showed what technology could do, as computers evolved and became more powerful and affordable. We had growing data, improving software, and better processors, and the mouse became a standard part of a PC setup. Thanks to the many advances and improved affordability, using a home computer became popular and led to millions of new users.
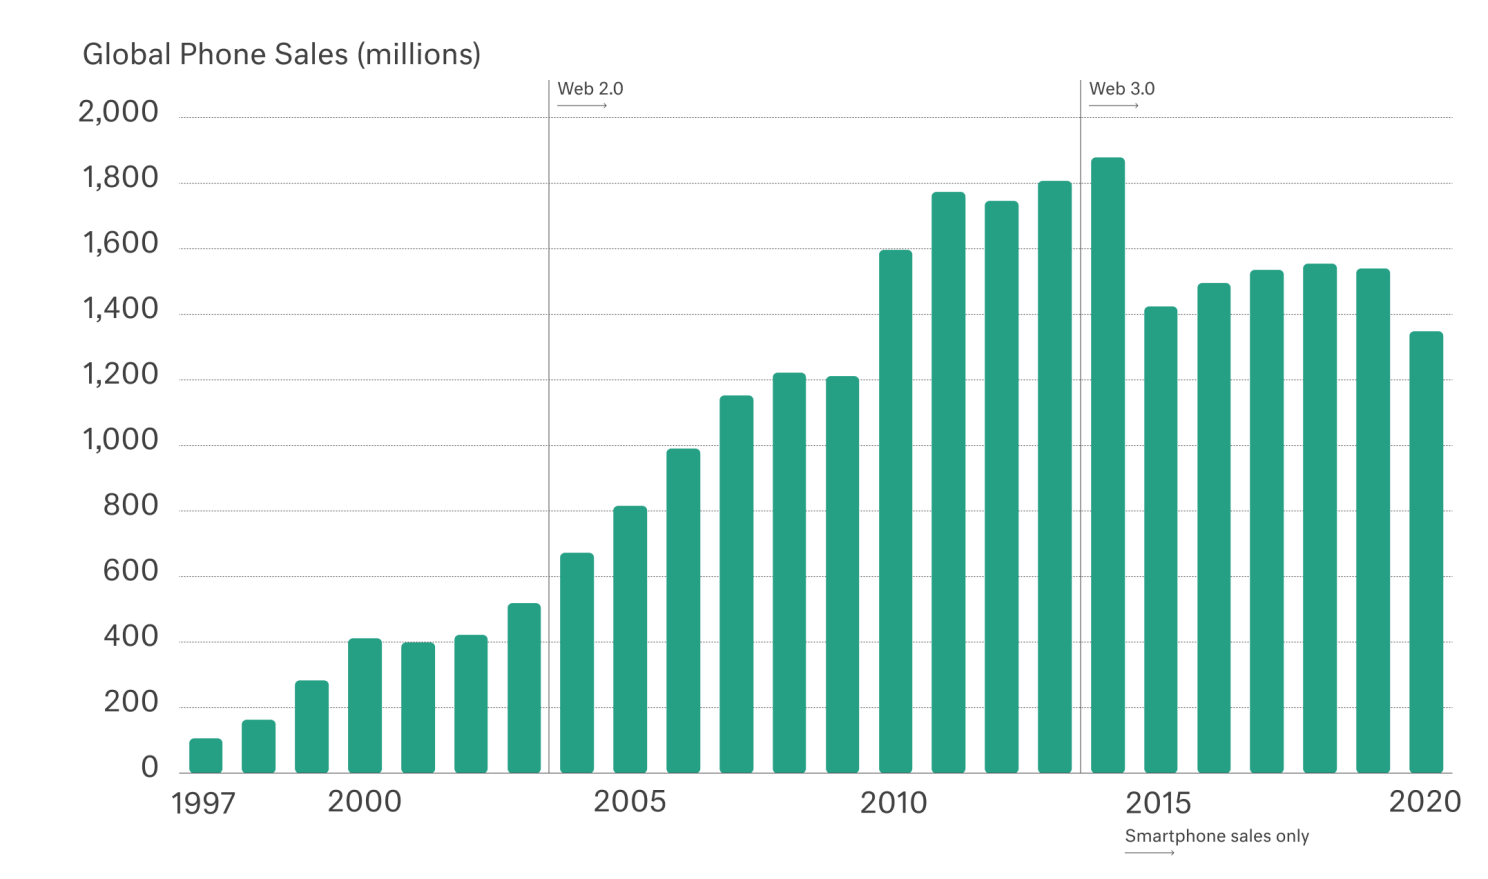
The growing number of computers and users started outlining the nodes of a network that did not exist yet. But soon enough, we came up with new ways of sharing and visualizing data and information beyond disks, and this eventualy led to the birth of ‘the web’.
CLEVER°FRANKE is a data design and technology consultancy that creates data-driven experiences. We pioneer through data, design, and technology to unravel complexity and help people make sense of the world around them. C°F's work results in data-driven web products, installations, visual identities, data design systems, and visions for global operating clients like Google, Warner Music Group, and the United Nations.
- CLEVER°FRANKE

- CLEVER°FRANKE

- CLEVER°FRANKE

- CLEVER°FRANKE


