
It’s hard not to be shocked by “Historical Geography,” a map by John F. Smith from 1888. By overlaying a strange “tree” shape with such strong (and strange) language, it breaks with our understanding of what a US map looks like. It’s less of a map and more of a provocation.
I ran across this map during my research on W.E.B. Du Bois and I couldn’t find very much about it. Unfortunately, I still can’t find very much about this map or its moralist creator, but I can try to decode it a bit, in order to leave a few clues on what its creator might have been trying to present.
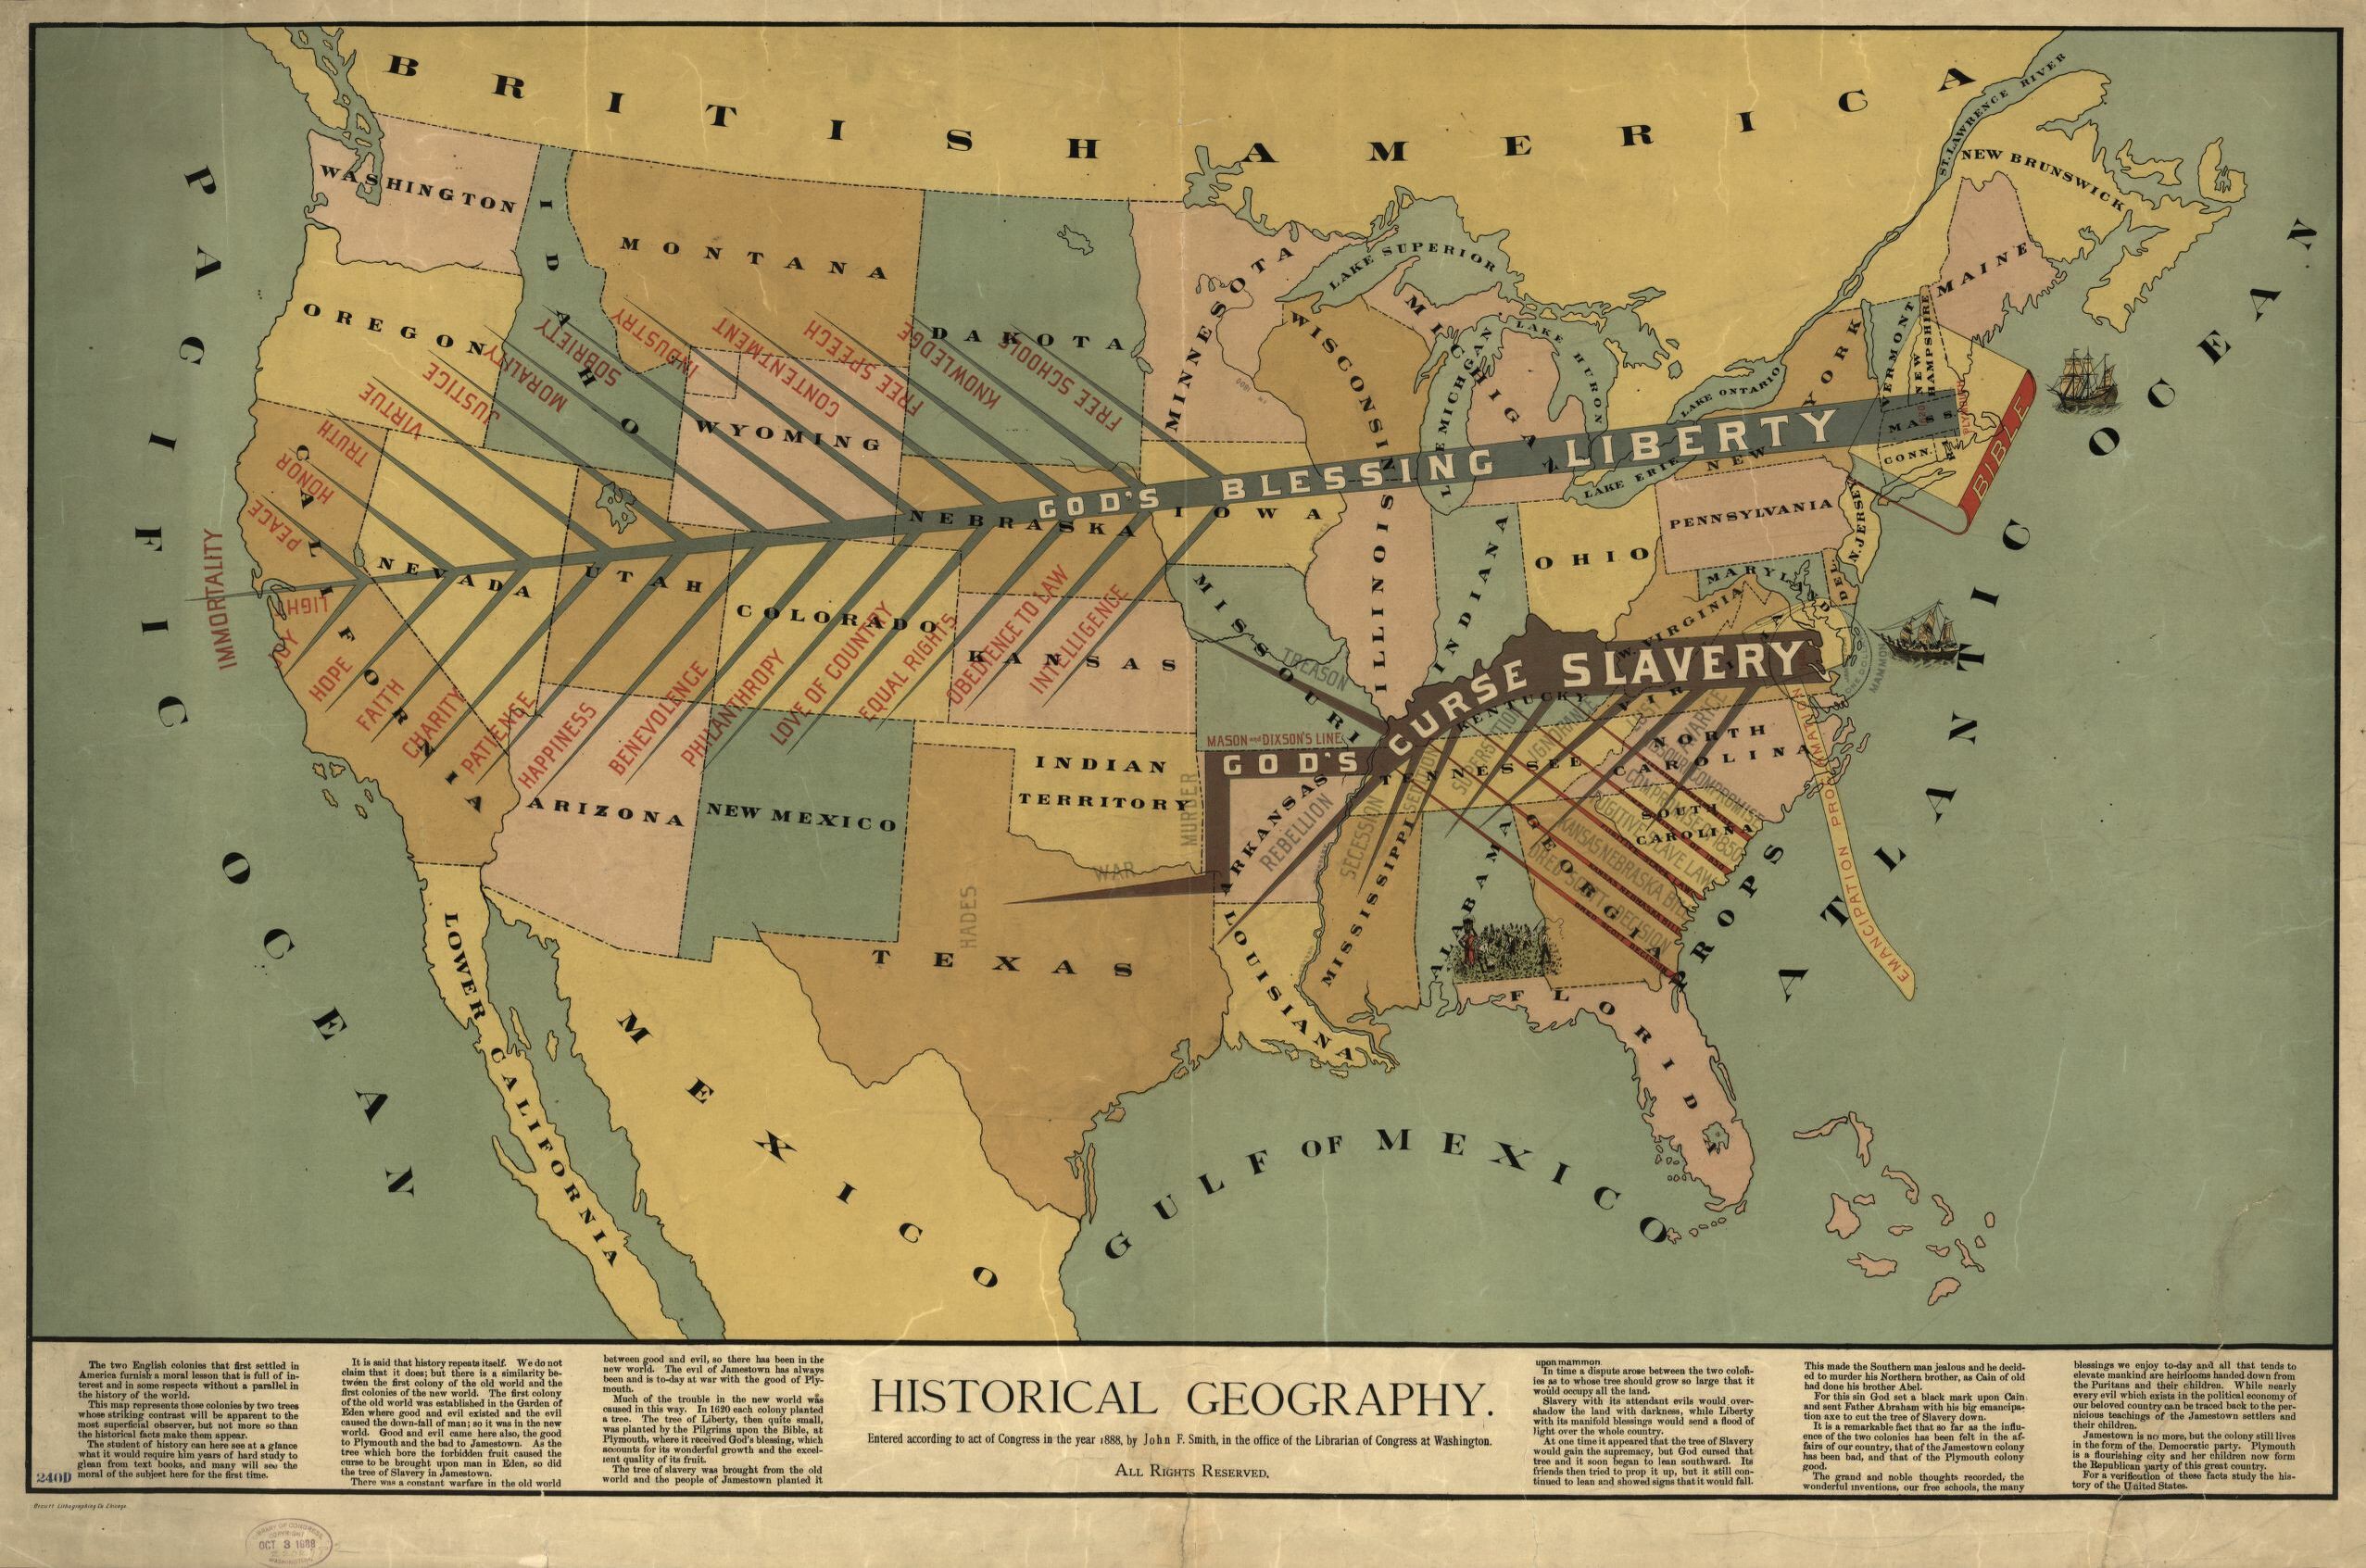
What makes “Historical Geography” so unusual is that it conflates biblical virtues with the history of Slavery in the United States. The map shows the “two trees” of slavery vs. liberty with Jamestown representing money, slavery (and everything bad) while Plymouth is the source of the Bible, intelligence, sobriety, and light itself.
Smith describes in the annotation at the bottom “The two English colonies that first settled in America furnish a moral lesson that is full of interest and in some respects with a parallel in the history of the world. This map represents those colonies by two trees whose striking contrast will be apparent to the most superficial observer, but not more so than the historical facts make them appear.”

Liberty’s tree originates in Plymouth, it’s attendant boat bobbing gently beside an oversized Bible. A barely visible 1620 is stamped in red. Smith continues in the bottom text “…there is a similarity between the first colony of the old world and the first colonies of the new world. The first colony of the old world was established in the Garden of Eden where good and evil existed and the evil caused the down-fall of man; so it was in the new world. Good and evil came here also, the good to Plymouth and the bad to Jamestown. As the tree which bore the forbidden fruit caused the curse to be brought upon man in Eden, so did the tree of slavery in Jamestown.”
The other tree originates at Jamestown and is inscribed as a one-dollar coin and branded as “Mammon,” which was a pejorative for material wealth gained by an evil influence. Smith strangely includes an almost invisible 1620 date label despite the colony being founded in 1607. The colony’s corresponding ship is both larger and more angular.

Amazingly, Jamestown is also the site for the solution to the tree of slavery — in the form of an axe head pointed at the coastline, it’s handle labeled with the emancipation proclamation. Smith elaborates on his all or nothing duality, “There was constant warfare in the old world between good and evil, so there has been in the new world. The evil of Jamestown hs always been and is today at war with the good of Plymouth.”
The importance of the analogy of the tree in American history
Jared Farmer in Oxford University’sThe Journal of American History, recently explored the importance of the “tree” concept in American history, beginning with the provocative statement “Extralegal violence committed by white men in the name of patriotism is a founding tradition of the United States.”

He is referring to the Liberty Tree, a famous elm that stood in Boston in the years before the American Revolution. At first, the tree was the site of demonstrations against the British in the wake of the Stamp Act, but over time effigies turned to real bodies. Farmer continues:
“In the antebellum United States, abolitionist newspapers regularly printed toasts and lyrics about the glorious tree that bore the fruit of freedom. But for many white male citizens, the arboreal symbol retained its base meaning — regeneration through violence. Henry Ward Beecher, in a collection of pastoral quotations, captured the idea: “A traitor is good fruit to hang from the boughs of the tree of liberty.” Thomas Jefferson, in private, had voiced a similar sentiment in 1787: “The tree of liberty must be refreshed from time to time with the blood of patriots & tyrants.”
In this way, the ‘tree of liberty’ evolved from symbolic political resistance to violent retribution. Then after the end of the U.S. Civil War, the tragic irony of its symbolism shifting again to racial hatred as over a thousand African Americans were lynched between 1882–1900. Blood begets blood.

Emancipation and western expansion
Covering the majority of the map is a tree labeled ‘God’s Blessing Liberty’ that sprouts branches across the country with admittedly great things like happiness, free speech, and peace. It cuts a straight line to the Bay area in California, which was also the approximate route of the transcontinental railroad. But let’s take a step back to explain why the golden state was the end goal of liberty.
The debate over slavery in the east erupted at the same time as the Mexican–American War. Many Southerners sought to expand slavery to the newly acquired/conquered lands in order to create an economic block across the southern states. The Compromise of 1850 tied together the two conflicts and helped delay the outbreak of the US Civil War for another decade. In the compromise, Texas surrendered its claims to New Mexico in return for tax relief. California was admitted as a free state and New Mexico and Utah became states. The citizens of each territory would get to decide whether or not slavery would be permitted.

Underpinnings of Moralism
Throughout the 19th-century, Moralism spread its puritanical philosophy across American and British societies focusing on a certain set of morals, including the American ethos of “justice, freedom, and equality.” It held a huge influence on both American and British cultures and often mixed personal beliefs onto societal norms and public policy. Sociologist Malcolm Waters writes, “Moralism emerged from a clash between the unrestrained character of frontier expansionism, a middle-class, Protestant emphasis on respectability cultivated in small-town America and an egalitarian and anti-intellectual evangelism among splinter Protestant groups.”
Moralism’s “twin pillars” of abolition and temperance were still very much issues in 1888 as the country was still recovering from the US Civil War and western expansion was in full swing. The Reconstruction Era was a period of widespread volatility. While Slavery had been outlawed with the 13th Amendment in 1864 and the Freedmen’s Bureau provided sweeping new opportunities to former slaves, the North (and their army) was largely forcing southern states to comply. By the early 1870s Northerners were tiring of the political and financial effort that Reconstruction required and was ready for the South to take care of itself. The Southern states were all too happy to self-govern so that they could erode rights for African Americans using Jim Crow laws and establish legal segregation.
This brings us back to “Historical Geography.” As the lower tree, ‘God’s Curse Slavery,’ winds across the south on the way to Texas (actually to Hades itself) it is crossed by the various compromises that supported the curse of Slavery (including the Missouri Compromise). Each red spike is a needle furthering the cause of white supremacy. The named lower tree’s branches start at bad and end at worse. Avarice, lust, and superstition eventually beget treason, murder, and war.

Who was John F. Smith?
It’s been difficult to find much information on a name as generic as John F. Smith. I know he is from Newport, Kentucky, which sits just across from Cincinnati, Ohio, and is about as far north as you can get while still being in a southern pro-slavery state. On his map, Smith would be located at the highest point on the Slavery tree, the hill between the words “curse” and “slavery”. It is clear he was an abolitionist and a moralist from the text at the bottom of the map but I could not find any other abolitionist or moralist documents under his name.

He was very interested in civic issues and wrote a pamphlet in 1862 called “Red, white and blue; a short treatise on a subject of greater importance to the people of the United States, than any that has been presented to them since the Declaration of independence” which is an unhinged appeal to move Washington D.C. to the geographic center of the country on the banks of the Mississippi River and transform it into a ‘mound city’. He calls himself “a friend to progress” in another technical pamphlet on draining swamplands in 1857, but that’s about it. This suggests he was likely involved with politics to some extent and it’s very possible that as he grew older he became more radically idealistic.
Presidential politics were a hot mess then too
“Historical Geography” was likely created as an attempt to influence people during the 1888 United States presidential election. That election saw New York Democrat Grover Cleveland win the popular vote, but Republican Benjamin Harrison won the majority in the Electoral College and therefore the presidency. (Yes, it played out just like the 2016 election, but the margin was even smaller.)

Granted, the political parties of the time were ideologically opposite of what they are today. Generally speaking, Republicans were for more federal government as a way to support the north and extend rights to minorities. Democrats wanted more states’ rights so that they could economically outmaneuver the north while repressing and exploiting former slave populations to get the work done
Smith’s two trees correspond exactly to the 1888 electoral results below. In abolitionist terms, the tree of liberty translates to the republicans and slavery to the democrats. Smith says it himself at the very end of the text at the bottom of the map: “Jamestown is no more, but the colony still lives in the form of the Democratic party. Plymouth is a flourishing city and her children now form the Republican party of this great country.”
Historian Susan Schulten writes in her book Mapping the Nation, History and Cartography in Nineteenth-Century America, “The map is more a statement of Republican Party identity than historical geography … But in another significant way … it depicts an active struggle between two competing and incompatible visions of the nation’s future.”The map, in essence, displays the bipolar and contradictory nature of the nation from either position at that time. Incongruous partisan ideologies become a lens by which to subjectively view the history of our country and its population. Good and Evil, Right and Wrong, Liberty and Slavery all are reduced to Republican and Democrat.
A perfect reflection of the Gilded Age — then and now
History is a difficult concept to really nail down and the distant past is even more difficult to understand with nuance and context. The Gilded Age was a period in US history that was rife with excitement, scandal, innovation, tragedy, wealth, and inequality. It was a time in many ways reminiscent of the present day, when scientific innovation, private wealth, and religious zeal are entangled with intense political partisanship, scandals, and corruption.
“Historical Geography”, therefore, was a map of religious zeal aiming to influence partisan politics. While we might find Smith’s map to be unusually aggressive, what happens today is not dissimilar to how it was in 1888. With the conflation of religion and politics and the collapse of authority, our world is struggling with similar issues of factuality. Books like Albert Cairo’s How Charts Lie and Caroline Criado Perez’s Invisible Women (to name just two) help us understand how to make sense of the world and what bias to consider.
This is why it so compelling to dig into the background around historical data visualizations: By linking the past to the present we understand so much more about both. Taking the time to learn the context — then and now — is always an enriching experience.

Jason Forrest is a data visualization designer and writer living in New York City. He is the director of the Data Visualization Lab for McKinsey and Company. In addition to being on the board of directors of the Data Visualization Society, he is also the editor-in-chief of Nightingale: The Journal of the Data Visualization Society. He writes about the intersection of culture and information design and is currently working on a book about pictorial statistics.
- Jason Forrest

- Jason Forrest

- Jason Forrest

- Jason Forrest


