
What do a dictionary entry, the Electoral House of Bavaria’s family tree, and Compact Rectangular Euler Diagrams have in common? These are among the dozens of text-based visualizations that you will find in Richard Brath’s new book, Visualizing with Text. The book, based on the author’s Ph.D. research, seeks to provide a framework for creating and interpreting data visualizations with text. It covers multiple ways text can appear with visualization: as a legend, label or annotation, an accompanying narrative; or a block of prose with visuals added to make it easier to read or understand.
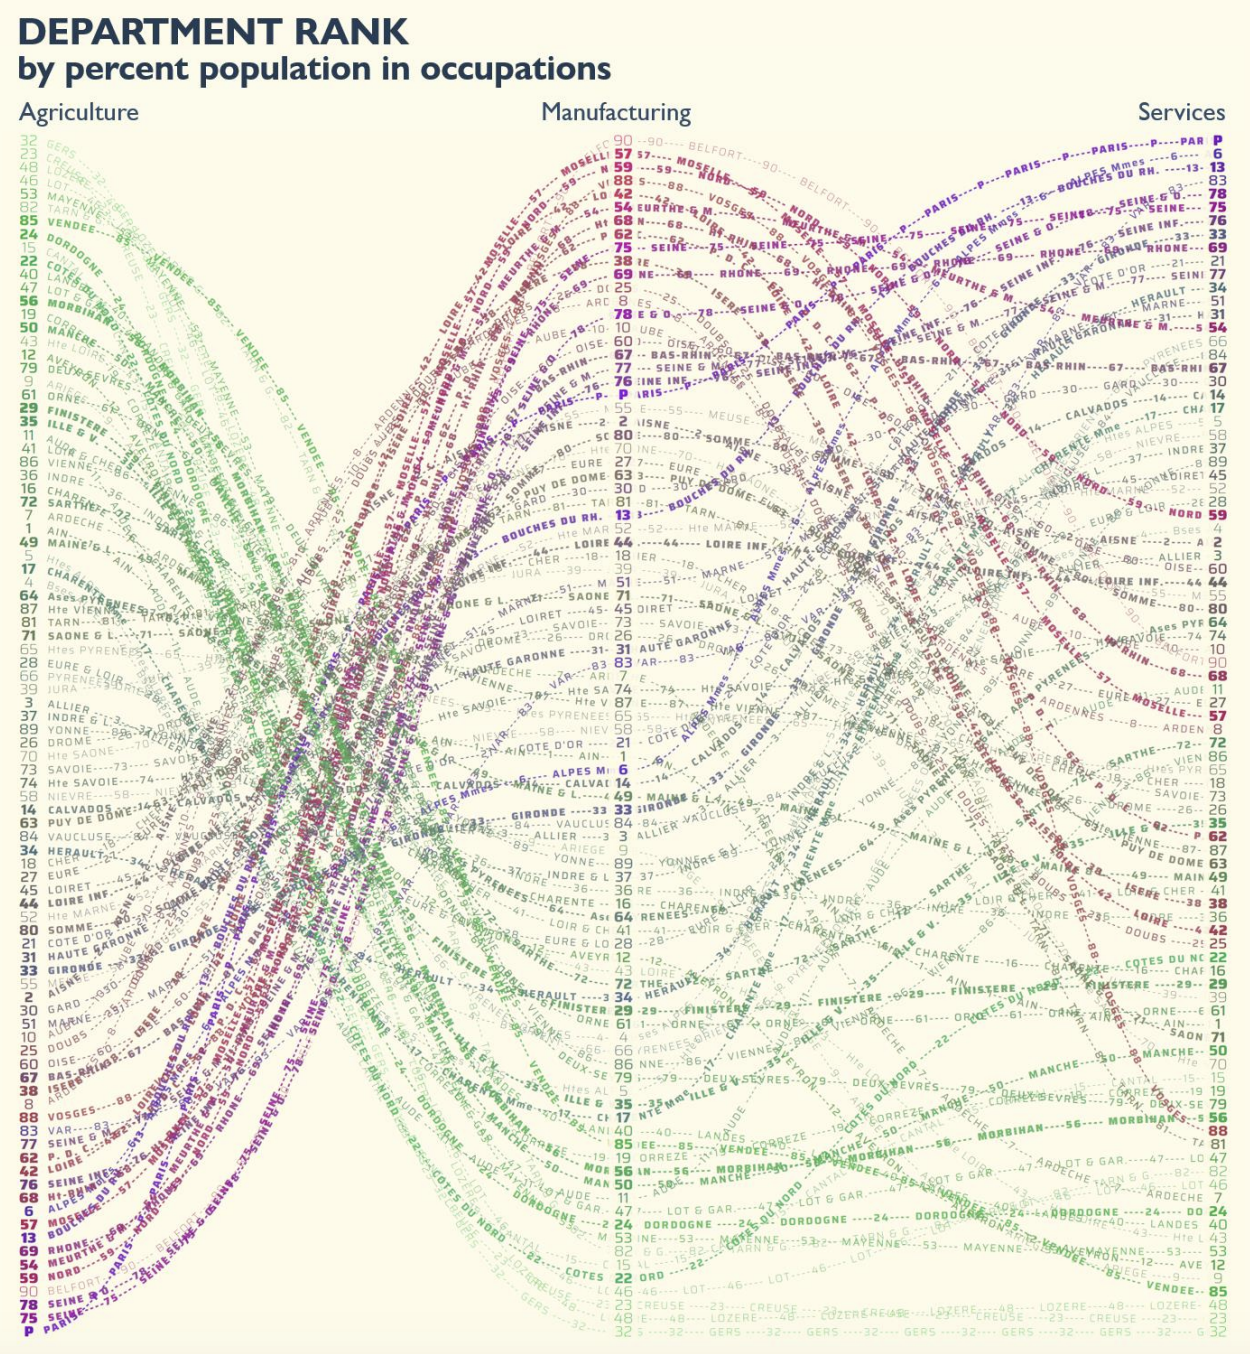
The book showcases a diverse collection of text-based artifacts — ranging from train schedules and auction posters to financial analysis tools and hashtag maps — to which Brath adds many original visualizations (some are on his Observable). Using datasets like the text of Alice in Wonderland and Jacques Bertin’s study on the French economy, the book demonstrates a variety of techniques and carefully evaluates their advantages and challenges.
Some techniques could become mainstream right away: why shouldn’t we annotate more text with inline pronunciation guides to help struggling readers? Others are experimental, like a paragraph of text with superscript labels scattered throughout, where the location of the superscript represents a value for that label. This, like Apollinaire’s Calligrammes and the post-modernist magazines that Brath cites, is notable for its edginess more than its practicality.

Visualization creators must consider what their readers will be able to do or learn from their graphics. Brath describes his experiments for measuring the effectiveness of different visual encodings: one, using the graph below, asks subjects to name which character is most afraid. Effectiveness here generally means the speed and accuracy with which someone can find a data point in a graph, and Brath found that placing text markers directly on a scatterplot improves these results versus using shapes and color markers with a legend.

Another factor Brath considers is preattentive processing: the way the fast-thinking parts of our brains detect patterns without much effort. (Think about the Stroop effect, whose name I never knew until I read this book.) Reading is not preattentive, but text visualization can be, depending on the attributes we use. Brath shows how text formatting can make letters or words stand out before we interpret their meaning; these examples are persuasive because we can feel them work on us as we are reading the book.

Combine enough different formats together, and we’re back to the slow brain. Brath experiments with the intersections between text attributes: one category of text in italic and rotated, another in caps and underlined, with different colors for each. It was easy to tell which markers belonged to the same category, but I still had to refer back to the legend to identify that category. In the example below, where each label has a combination of color, bold, caps, underline, font, and obliqueness, it took concentration for me to decode each label, and more than once I struggled to register all of a label’s attributes, even though I had just looked at the legend.

Sometimes it’s more important for readers to detect patterns or trends than to find a specific data point. One of the book’s greatest insights is that encoding text with visual attributes allows readers to move up and down the levels of detail in the same visualization — zooming with one’s attention. Good design can direct a reader’s eye to what’s most important without omitting secondary or tertiary information they might see on a subsequent pass. The book does offer suggestions for enhancing visualizations with interactions like filtering and tooltips, but it mostly abides by the words of Archie Tse, whom Brath quotes early on: “If content is important for readers to see, don’t hide it.”
Many of Brath’s techniques will differ across audiences and cultures. Can you truncate country names on a map to three characters, or abbreviate industries in an economic chart so your labels are more equally sized? It depends on your audience’s familiarity with the subject matter; you don’t save time if they must continually refer back to a lengthy lookup table. Some attributes have country-specific semantic associations, like red and blue in American politics, while obliqueness (left, center, or right slant) could be more universally accessible.

The idiosyncrasies of languages, writing, and fonts are also at play. The book shows how the different densities of Japanese Kanji and Kana characters signify the importance of words in a sentence, and points out semantic associations between typefaces and corresponding genres (e.g., Eurostile Extended Bold and sci-fi) or emotions (e.g., blackletter and anger). In an exploration of the familiar dataset on the demographics and fates of Titanic passengers, Brath uncovers that printing each passenger’s full name, grouped by ship class, distorts the visualization even if it humanizes the subjects: people in higher classes had on average longer names. Beware spurious correlations!

Some of Brath’s suggestions were very easy to imagine implementing while others seemed like they would require (at least) Photoshop. I realized how strongly my associations with fonts and formatting are influenced by the word processors I learned to write on. How much do the interfaces of Microsoft Word, Google Docs, or Medium constrain our imaginations when it comes to enhancing text with visual attributes? What opportunities might we miss because they can’t be done with a single CSS property or SVG attribute? This book inspires us to look beyond the toolbar defaults.
The prospect of routinely seeing visual encodings in and alongside text is very exciting for people who love data visualization. Text is a vast medium that visualization can both improve and benefit from, and some of Brath’s ideas could revolutionize print and digital writing. Taking these ideas to a wider audience would require developing new areas of data literacy education on how to read text-rich visualizations, and it would require new tools to automate and standardize advanced graph types like Venn diagrams, cartograms, and dynamic inline highlighting. If this excites you, I recommend that you pick up the book, then do what design-minded people do best: find an inspiring example, adapt it, and iterate.
All images are from Richard Brath’s website under CC BY-SA 4.0.
- Alec Barrett


