
The best-designed dashboard can still lose to a spreadsheet, because adoption is a social problem, not a visual one.
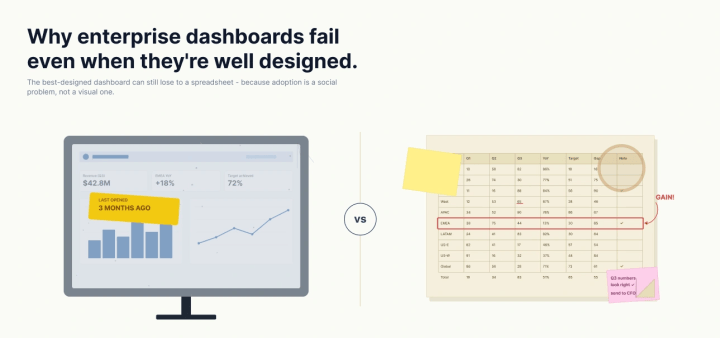
I have built dashboards that did everything right and still died quietly. Clean layout, honest encodings, a sensible visual hierarchy—the sort of thing you would be happy to put in a portfolio. Three months later, nobody was opening them.
For a long time I treated that as a design failure. If the dashboard was not used, surely I had missed something on the canvas. So I would iterate on the canvas: tighter grids, better color, fewer chart types. It rarely helped, because I was fixing the wrong layer.
Here is the thing I have come to believe. Once a dashboard reaches a certain level of craft, its fate is decided somewhere you cannot see from the design tool. It is decided in how people define their words, whether they trust the number, and who gets to add “just one more” thing. Adoption is a social problem wearing a design costume. Let me show you the three costumes I see most and what it actually took to get past each one.
The metric nobody defined
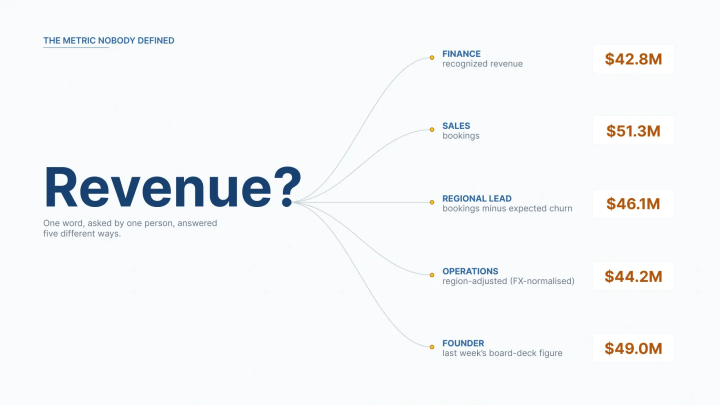
Picture a revenue dashboard that is, by every visual standard, excellent. Now picture the meeting where it is unveiled, and five stakeholders quietly disagree about what “revenue” means.
To finance, it is recognized revenue. To sales, it is bookings. To the regional lead, it is bookings minus expected churn. To the founder, it is whatever number was in last week’s board deck. Nobody says any of this out loud, because everyone assumes their definition is the definition. The dashboard shows one figure, so it is wrong for four of the five people looking at it, all at once.
What happens next is not a design conversation. It is a standoff. The chart did not fail; the shared vocabulary failed before the chart was ever drawn. You cannot fix a vocabulary problem with a better bar chart, because the disagreement is not about how the number looks. It is about what the number is.
I saw this clearly on a real-estate analytics project. Terms that everyone used casually—price, property type, agent performance, a location’s numbers—each meant slightly different things to different teams, and every dashboard inherited that ambiguity. The fix was not visual at all. We built a governed semantic layer—a single, boring, authoritative place where each of those metrics was defined once—so every chart everywhere drew from the same definition. Only after the words agreed did the visuals start to land. Adoption of the analytics rose by 55%, and reliance on analysts for basic answers dropped by about 25%, not because the charts got prettier, but because people finally trusted that they were all looking at the same thing.
This is the failure that most convincingly masquerades as a design flaw. Stakeholders will say a dashboard is “confusing” or “not quite right,” and a well-meaning designer hears a request to redesign. It is not. It is a request, usually unconscious, to go back and define the terms.
The executive who kept the spreadsheet open
The second pattern is quieter, and it stings more. You ship a genuinely better tool, and the person it was built for keeps their old spreadsheet open in the next tab.
You know the spreadsheet. It is ugly, the formulas are fragile and undocumented, and it breaks if you sneeze near a merged cell. Your dashboard is faster, cleaner, and more reliable by every measure that shows up in a demo. And still they go back to the spreadsheet, because they trust it, and they do not yet trust you.
Trust, it turns out, is not earned by being correct. It is earned by being legible. The executive can see exactly how their spreadsheet gets its number, because they built every step of it. Your dashboard, however well designed, is a black box to them until proven otherwise. Familiarity beats better design whenever trust is missing, and trust is missing by default.
The thing that moved this for me was not a better chart; it was moving the conversation earlier. When stakeholders co-design the dashboard before it is built, sketching it as a low-stakes mockup they can react to and change on the spot, they stop being recipients of a black box and start being co-authors of a tool they already understand. In practice, letting people see and shape the thing before development turned the holdouts into advocates, and it is a large part of why adoption climbed rather than stalled. You are not persuading someone to trust a finished product. You are removing the reason they distrusted it in the first place.
The “one more KPI” problem
The third pattern is the one you build with your own hands, one reasonable decision at a time.
A dashboard usually starts focused. It answers a single question well: Are we on track, and if not, where? Then the review meeting happens. Someone asks, entirely reasonably, whether you could add customer acquisition cost. Someone else needs regional breakdowns. A third person cannot approve it without a year-over-year comparison. Every request is defensible on its own. Not one of them is wrong.
Then the requests compound, and nobody is responsible for the total. I watched this reach an extreme in an analytics environment for a market-research firm. The reporting had grown to 66 separate dashboards, and the underlying design had ballooned to roughly 49,200 calculated fields, because at one point almost every table cell had become its own metric. It was not one bad decision. It was thousands of reasonable ones, and the result was a reporting estate no stakeholder could navigate.
Fixing it meant treating focus as the actual deliverable. By restructuring the data upstream and consolidating the reporting into a far smaller set of dense, interactive views, we cut the number of dashboards by 96.97% and the calculated fields by 99.85%, and dashboard performance improved by about 95%. The analytical depth was preserved; what disappeared was the sprawl. The lesson was blunt: A dashboard that answers one question brilliantly beats one that answers 40 questions dimly, and someone has to be willing to defend that.
The reason this is so hard to stop is that saying no to a key performance indicator (KPI) feels like saying no to a person. Adding it is frictionless and makes someone happy today. Refusing it requires a conversation about focus that most teams would rather avoid.
The pattern hiding in all three
Look at those three failures side by side, and the common thread is obvious. None of them is a design problem.
The first is a definition problem. The second is a trust problem. The third is a governance and focus problem. In every case the pixels were fine; the organization around the pixels was not. This is why polishing the canvas so rarely rescues a struggling dashboard, and why the industry’s adoption numbers have stayed stubborn for years. According to IBM’s analysis of the Gartner figures, business intelligence tools still tend to reach only about a third of the employees who have access to them—a ceiling the field has struggled to break for a decade.
We keep buying and building our way past that ceiling with better visuals, and the ceiling does not move, because it was never a visual ceiling.
What actually moves adoption
If the failures are social, the fixes are too, and they happen mostly before you open the design tool.
Start with the definitions. The single highest-leverage thing I do now is refuse to design a metric until the room agrees on what it means, and then lock that agreement into a governed semantic layer so every chart inherits one meaning. It is unglamorous work. It is also the difference between a dashboard people argue with and one they argue from.
Next, design for trust, and design it early. Co-design the dashboard with stakeholders before you build, using a throwaway mockup rather than a finished product. The fights about definitions and about “one more KPI” then happen over a sketch, when they are cheap to resolve, instead of after weeks of development, when they are expensive and political. In my experience that single change does more for adoption than any amount of post-launch polish.
Then protect the focus. Treat every new KPI as a request that has to earn its place, and be willing to consolidate ruthlessly when the estate has sprawled. Cutting a reporting environment by more than 90% sounds destructive; done right, it is the opposite, because what you remove is noise, and what you keep is the answer.
The dashboard designer as diplomat
None of this is what most of us signed up for. You get into data visualization because you care about the craft—the encoding, the honest and beautiful representation of information. Then you discover that the craft is maybe half of what determines whether your work matters.
The other half is diplomacy: getting five people to agree on a word, earning the trust of someone who has every reason to doubt you, and saying a graceful no to a KPI so the whole thing stays legible. The best dashboard people I know are half information designers and half organizational translators, and they are not embarrassed about the second half.
So the next time a well-designed dashboard is not being used, resist the urge to reopen the design file. The problem is probably not on the canvas. It is in the room, and that is where you will fix it.

Raghav Kedia
Raghav Kediais an associate principal, engagement, at NeenOpal, a data and AI consultancy, where he leads enterprise analytics and business intelligence engagements across North America, EMEA, and APAC. He has spent years building and delivering dashboards for enterprise teams, with a focus on data strategy, data visualization, and the harder problem of getting analytics adopted. He works across Tableau and the major cloud platforms: AWS, Azure, and GCP.


