
On New Year’s Eve 2016, two large posters appeared on walls around Brooklyn. One showed a New York Times front page marked up in red ink with notes, edits, and redactions. The page was from the Times’s 2014 coverage of the shooting of 18-year-old Michael Brown by police officer Darren Wilson in Ferguson, Missouri. Under the Times’s headline “Two Lives at Crossroads in Ferguson” sat two side-by-side profiles: Wilson’s read “A Low-Profile Officer with Unsettled Early Days”; Brown’s read “A Teenager Grappling with Problems and Promise.”
The second poster reimagined that front page entirely: a full-page graduation photo of Brown beneath a single headline, “A Teenager with Promise.”
The posters launched artist Alexandra Bell’s “Counternarratives” series, which examines how the media’s choices about words, images, and layout produce narratives that favor the powerful and harm the marginalized.
When we talk about how data and data visualization can do the same, we often open with Bell’s work because it makes a point that students of data visualization haven’t fully internalized: The editorial choices around the content shape what readers take away from it, sometimes as much as the content itself. And in charts and graphs, the most powerful piece of surrounding editorial real estate is often the title.
One chart, many stories
Today, growing attention to systemic inequities in wealth and earnings, the erosion of the social safety net, and the rise of AI tools that often reproduce stereotypical depictions of the world all make thinking carefully about framing more urgent. An exercise like this can help analysts and data visualization creators take a broader and more equitable approach to their work.
Here’s the exercise we’ve used in workshops and meetings with people who want to become more equitable and inclusive data users and data visualization creators.
We start with a warm-up that has nothing to do with charts. We show students two sentences that say essentially the same thing but swap the subject and object. The first sentence says, “Black people are less likely to get a loan from the bank.” The second sentence says, “Banks are less likely to give loans to Black people.”
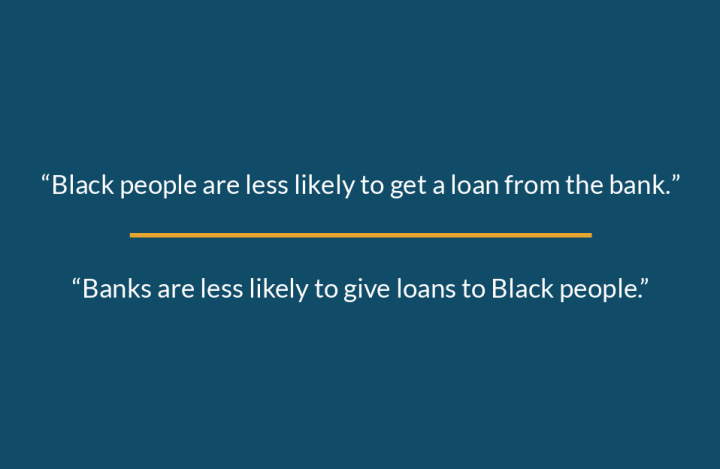
We talk about what each version implies. When Black borrowers are the subject, the sentence gives the impression that they are doing something wrong or lacking something. When banks are the subject, the sentence points to the banks’ power to choose who gets a loan. Participants quickly see how the subject of a sentence shapes who readers see as responsible.
We then move to data visualization. We show a straightforward bar chart comparing median family net worth for three racial and ethnic groups from 1992 to 2022. Throughout this period, white non-Hispanic families had much higher median wealth than Black non-Hispanic and Hispanic families.

Source: Board of Governors of the Federal Reserve System, “Survey of Consumer Finances” Chart by Jonathan Schwabish and Alice Feng
The assignment: Suggest a title for this chart.
What the titles reveal
The first titles people suggest are usually the kind we see on charts all the time—strictly descriptive, like “Median Family Wealth by Race and Ethnicity” or “Median Family Wealth for White, Black, and Hispanic Families, 1992–2022.”
We then ask participants to dig deeper. What do you want the reader to learn? Does a neutral, descriptive title tell the full story? How have historical, institutional, and structural forces shaped the data in the chart?
This pushes participants toward other kinds of titles, which tend to fall into three broad groups:
- The active, outcome-focused title. “White Families Have Far More Wealth Than Black and Hispanic Families.” It describes the outcome but still not what produced it.
- The deficit-framed title. “Black and Hispanic Families Lag Behind in Wealth.” Like the first loan sentence, this title locates the disparity in what Black and Hispanic families are missing, implying some shortcoming or failure on their part. This is deficit framing, and once students have a name for it, they can start to spot it everywhere.
- The interpretive title. Finally, we push participants to consider titles that name causes: decades of discriminatory policy in housing, employment, and lending that have channeled wealth toward white families and away from families of color. Titles like “Wealth Gaps Reflect Historical Employment and Homeownership Advantages for White Families” and “White Families Built More Wealth through Long-Standing Advantages in Employment and Homeownership” start to emerge.
It quickly becomes clear that titles—and any other annotations a creator adds—carry a big part of a chart’s message.
Honest caveats for discussion
Two complications come up in nearly every session:
First, students ask whether an interpretive title is editorializing—whether it crosses a line for, say, a government statistical agency or a nonpartisan research group. That’s a real tension, and the answer depends on the institution, the audience, the strength of the evidence, and the final product (for example, a standalone graph versus a graph in a longer report).
Second, a chart title is small. Some causal stories are too complex to compress into a dozen words, and a title that gestures at “structural factors” without explanation can feel like magical hand-waving. When the complexity outruns the title, the surrounding text has to dig deeper and explain the forces more carefully.
Reusing this exercise
The format travels well. All you need is one chart showing a gap or disparity between groups, a descriptive default title, and 10 minutes of writing time. It works with wealth data, but also with pay gaps, health outcomes, school discipline rates, or eviction data. It requires no special software or advanced data visualization skills, so it fits equally into a design course, a statistics course, or a one-hour workshop. And because participants generate the titles themselves, the deficit-framing examples come from the room, not from a slide, which makes the critique land as self-recognition rather than accusation.
Activity setup
If you’d like to run this activity in your own classes or workshops, here’s how we approach it:
Framing:
- This exercise works best once a class or workshop has already been focusing on equity and inclusivity in data visualization. Participants should understand how data reflect society and how gaps and omissions in data can mirror the priorities and hierarchies behind data collection.
- Good background reading includes Data Feminism by D’Ignazio and Klein (2020), Data Action by Williams (2022), and our forthcoming book, Thoughtful Data by Schwabish and Feng (2026). For research specifically on framing and chart titles, see Borkin et al. (2015), Kong et al. (2018), Holder and Xiong (2022), Holder (2022), and Stokes et al. (2022).
- Bring humility and grace to this exercise. You won’t always know participants’ personal or political beliefs, the implicit or explicit biases they bring, or how their experiences with race, gender, and other identities might shape how they engage. If a conversation stalls or gets heated, be ready to steer it somewhere constructive. We haven’t run into this ourselves yet, but it can happen, especially in larger, more mixed groups.
Materials:
- A chart that shows a gap or disparity between groups. We’ve used the bar chart above, as well as line charts showing gaps in poverty over time and differences in teen suicide rates over time.
- In person: We prefer handing out printed copies of the chart rather than just projecting it, so participants can look at it more closely. They can jot down ideas and alternative titles on the back or on their own paper. We’ve also used whiteboards or large self-stick flip-chart pads so participants can share their ideas with the whole room.
- Online (e.g., Zoom): Participants can use the chat window or a simple collaboration tool like Miro, Mural, or Google Slides.
Number of participants:
- The activity works for groups of almost any size. If there are more than 10 participants, consider splitting them into smaller groups of three or four (or breakout rooms for online sessions). Have each group brainstorm and then share its title ideas with the whole room.
- This activity is best suited for graduate students and professionals who are thinking critically about the role of data and data visualization in society.
Timing:
- 10 minutes to brainstorm an initial title for the chart.
- 20 minutes for a second round of title brainstorming. In this round, participants should think more critically about developing titles that are active and interpretive.
- 15 minutes for a debrief and reflection on how the titles have evolved between the two rounds, plus a facilitated discussion of using more active or interpretive titles.
Facilitation instructions:
- Begin by introducing the chart, describing the data shown, which groups are included, what time frame is shown, and other basics. Keep this stage purely descriptive; don’t get into the structures and institutions that may have shaped the trends in the chart.
- Ask participants to suggest a title for the chart. Record the suggestions somewhere the entire class can see, like a shared document, a slide, or a whiteboard.
- After the first round of title suggestions, ask probing questions to nudge participants to think more critically about what they want a reader to learn from the chart and whether the proposed titles accomplish that goal. For example, does a neutral, descriptive title help the reader understand what they are supposed to take away from the chart? Do such titles tell the full story? Do they communicate the historical, institutional, or structural forces that may have shaped the data shown in the chart?
- Again, depending on the size of the group, you might at this stage break up the class into smaller groups or keep everyone together.
- In either case, kick off a second round of title brainstorming by asking participants to think of new titles based on the previous discussion (either all together or in their smaller groups). Record these new suggestions in a separate document or slide. Where it makes sense, sort them by type: active, outcome-focused titles; deficit-framed titles; and interpretive titles.
- Compare the new titles with the original suggestions. Discuss how the new titles help readers gain a more complete and accurate understanding of the disparities shown in the chart.
- Wrap up the conversation and activity by summarizing how the suggested titles influence readers’ understanding of disparities and the trade-offs of using different types of titles. In our experience, participants come away more aware of the biases built into data, and of how they can put the structures and institutions that shaped the data in context in their own charts and graphs. Some participants will push back on packing too much certainty, or too many complex factors, into a short title—a fair point—but we often note that the surrounding text (if the graph appears in a report) can go into more depth.
If you try it, we’d love to hear what titles your students come up with.
This piece is adapted from a chapter of Thoughtful Data: A Guide to Empathy and Equity in Data Communication (Columbia University Press, forthcoming).

Jonathan Schwabish
Jonathan Schwabish is an economist, author, and data communication expert who founded the data visualization and presentation skills firm PolicyViz. He has written four books on data visualization and research communication, including Better Data Visualizations and Data Visualization in Excel. He also hosts the long-running PolicyViz Podcast on data visualization and data communication.

Alice Feng
Alice Feng is a data visualization designer and developer passionate about making data and information more accessible to broader audiences. She has created data visualizations at places such as the Urban Institute, the United Nations Development Programme, Axios, and Global Energy Monitor and has collaborated with organizations such as DataKind, Data4Change, and Data Science Africa. Alice has been exploring ways to bring equity and accessibility into the way data is visualized through her work on the Do No Harm Guide series.


