
I signed up as a mentee for my first-ever Data Visualization Society (DVS) mentorship program this year and immersed myself in 10 weeks of work with the zest and rigor I can only find when I’m doing something I’m passionate about.
I could not have wished for a better mentor than Rhea. Together, with the help and resources of the amazing DVS mentorship staff—Eleni Hoilman and Kateryna Oviedo—Rhea and I embarked on our project.
Since Rhea and I both work corporate day jobs, we decided to go with a lighter, more fun topic and settled on The Great British Bake Off, a show we are both big fans of.
The data came from Kaggle, and it was quite messy and disjointed. I spent a good amount of time cleaning and piecing it together across various seasons and episodes. Once the data was good to go and digestible enough, we began researching what themes and storylines we could find amid all of it. After a few tries, we landed on the question of what it takes to win the Bake Off.
With the topic narrowed down, we put together a list of key points to bring it to life. We added some playful touches, such as the top three flavors and signature bakes, along with the scoop on each of the winners of the first 14 seasons.
If you are not familiar with the show, it is a delight—well worth a watch. Check out the official site to see exactly how it works.
Each week has three challenges:
- Signature is a recipe of the baker’s own choosing, something they specialize in or have made many times before.
- Technical gives everyone the same instructions and no room to improvise.
- Showstopper asks for ambition and scale, judged on taste and visual aesthetic. The strongest baker of the week is named Star Baker, and a handshake from judge Paul Hollywood marks a bake he thinks is exceptional.
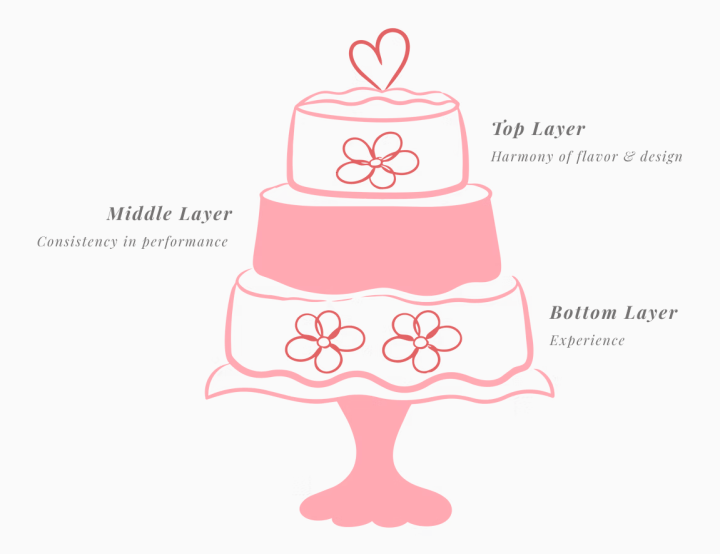
Bringing together the data and our experience of watching the show, we came up with three easy-to-follow recipes for success that we captured in the fun and elegant drawing of a three-layer cake below.
- To get to the top, bakers need to be seasoned and versatile enough to create bakes from around the world using a variety of baking techniques.
- Just as important, bakers need to perform consistently week after week. They cannot afford a weak week. When they have one, their chances of reaching the top drop sharply.
- Finally, bakers need a perfect harmony between flavor and design. Their bakes must not only look like works of art but also taste exquisite—top-notch all the way. If the bake is beautifully executed but lacks flavor, it will not receive a high ranking, as flavor is both the foundation and the top note of the bake.
We explored consistency further through a series of charts, each showing how steadily the winners performed compared with the rest of the field.

Source: Kaggle—Charts by Olga Strubbe
We then turned to the question that kept us both curious—whether demographic factors played a role:
- Does age matter?
- Does gender matter?
- Do bakers from certain occupations tend to do better than others?
We found no gender gap; male and female bakers were represented roughly equally among the winners and the wider field of contestants.
However, the age data showed that contestants in their 30s outperformed other age groups, taking seven of the 14 titles. With a sample of only 14 winners, though, the margin is narrow.
The charts below show the breakdown of contestants by age and gender, and how the win rates
compared across the age groups:

Source: Kaggle—Chart by Olga Strubbe

Source: Kaggle—Table by Olga Strubbe
As for occupation, the findings showed that most bakers came from business administration backgrounds, followed by education, with healthcare and science and engineering tied for third.
We represented this visually, using candles on a cake as an analogy:

Source: Kaggle—Chart by Olga Strubbe
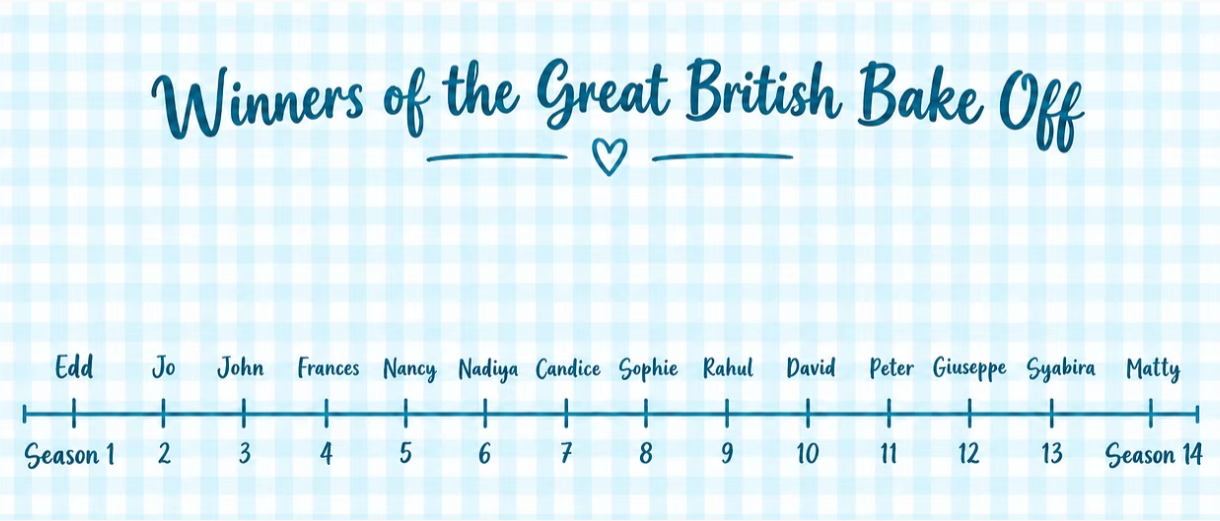
And last but not least, we laid out the winners of the first 14 seasons on a timeline and linked it
to learn more about each; in the original project, hovering over a name brings it up.

We included some fun facts about the top three flavors and signature bakes, sharing recipes to go along with them.
See how our story came together.
We hope you found this journey insightful—and that your mouth is watering in anticipation of that tasty treat! Maybe you even feel inspired to try making some of these bakes to share with your family and friends.
Go for it!


