
Axios launched in 2017 as a news organisation with the mission ‘Smart Brevity,’ emphasizing the power of saying more with less. Their method of storytelling aims to cut through the noise, getting readers to pay attention to what matters most. This style of journalism is extended to their data visualizations where the Data Visualization team led by Danielle Alberti focuses on removing as much extraneous information as possible, giving readers exactly what they need to understand the story.
The team creates everything from complex data graphics on serious subjects, like the US midterm elections or charitable giving by billionaires, to light and fun visualizations, like a proposal to float the container ship stuck in the Suez canal.
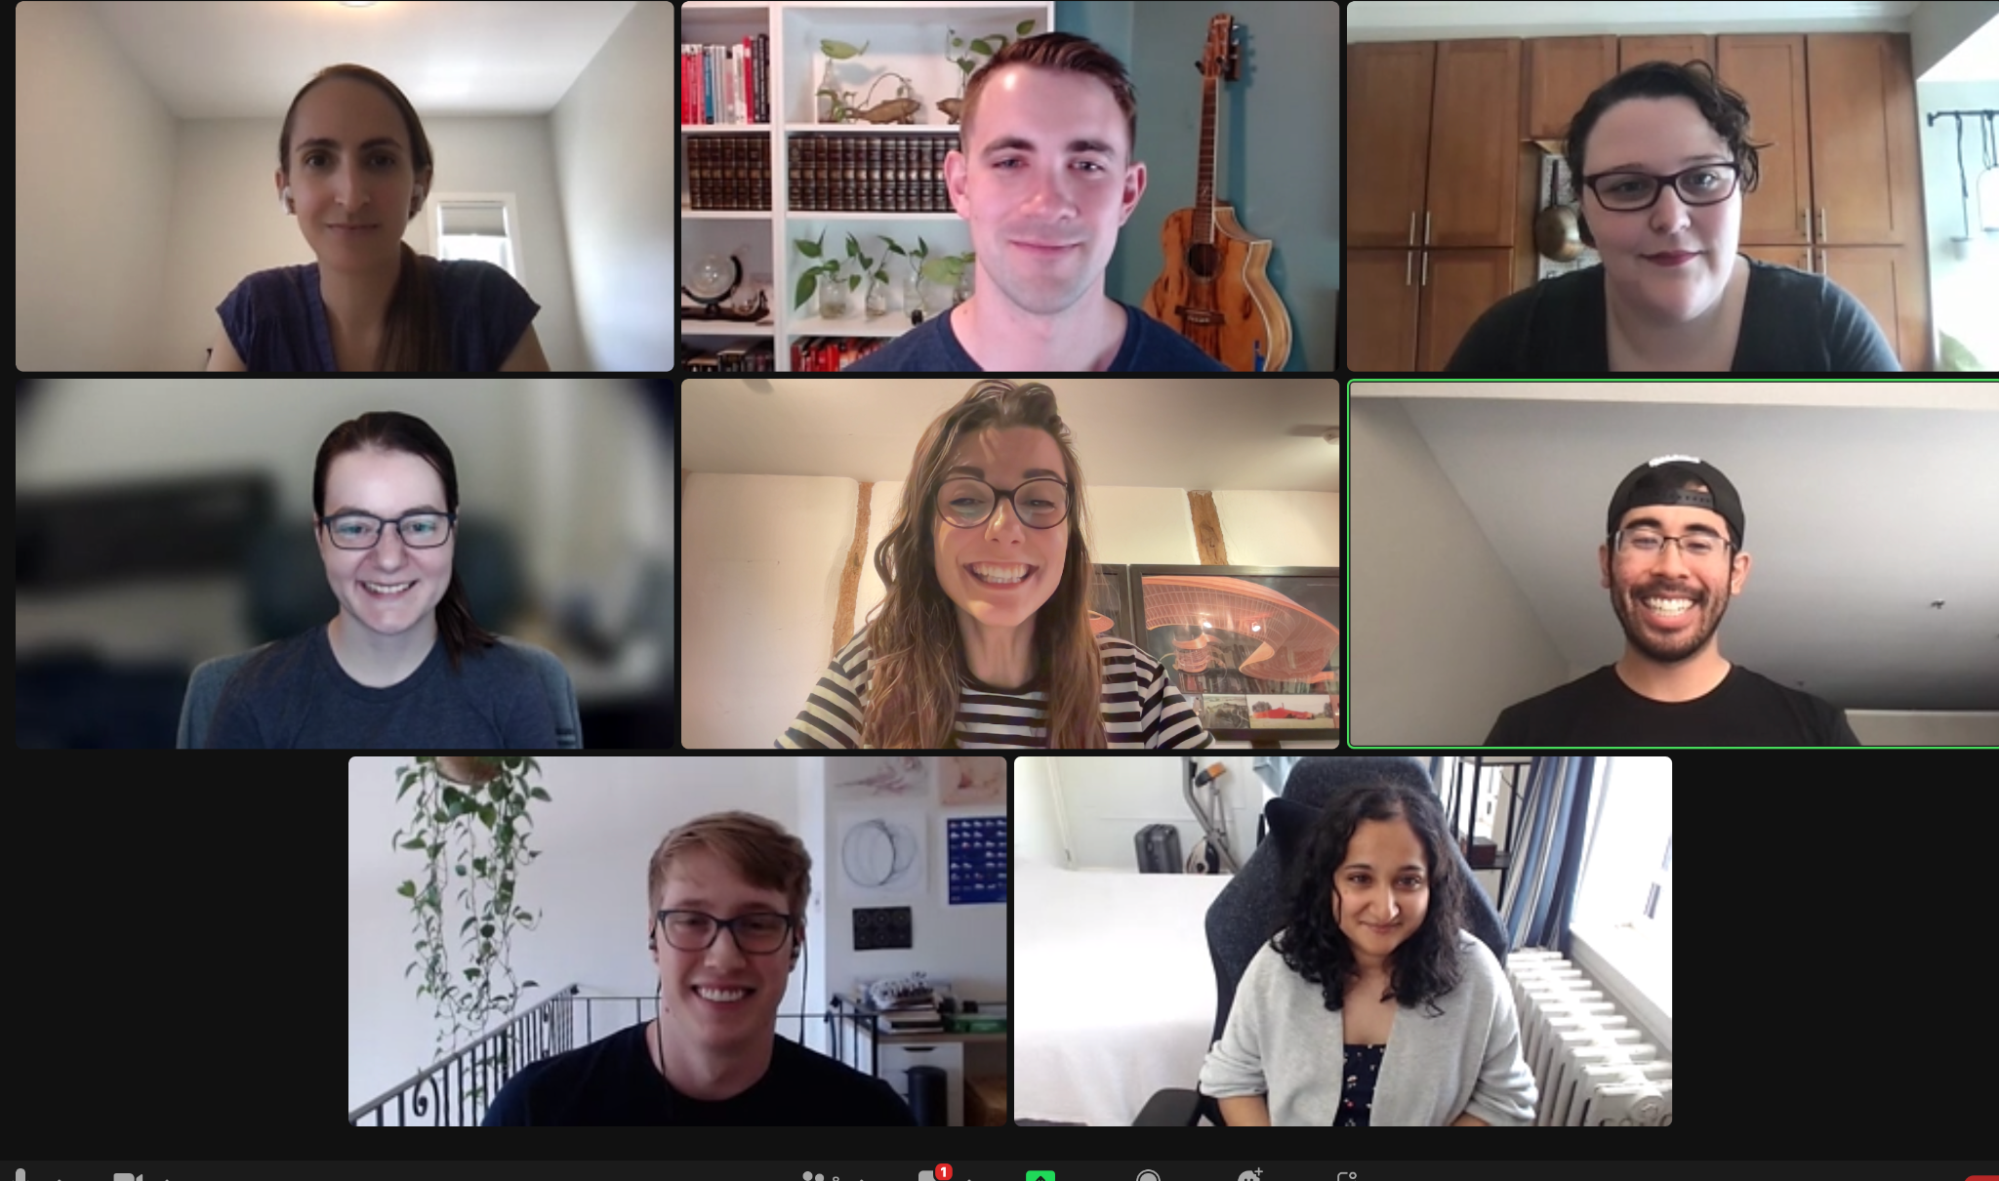
The Nightingale team recently had the opportunity to connect with several members of the Axios Data Visualization team to discuss their approach to data journalism: Danielle Alberti, Will Chase, Jacque Schrag, Kavya Beheraj, Jared Whalen and Thomas Oide.
The following interview was conducted over Zoom and has been lightly edited for editorial purposes.
Chesca: Thank you so much for joining us here at Nightingale. I can’t wait to hear about what you guys get up to. Can you start by telling us what your typical work day looks like?
Jared: A typical work day for the team is dependent on two things: If you are taking briefs from reporters who have chart requests, or if you have focus time to work on topics that interest you.
If you’re working directly with reporters, a typical day would include checking Slack for chart requests and having one-on-one conversations about what reporters are looking for. Sometimes they need something for a newsletter going out in a couple of hours; sometimes it’s for the next day.
Danielle: Regarding focus time, I encourage everybody to chase their own stories. Find things that are interesting to you, look at interesting datasets, make tools (which Jared and Thomas do a lot of), learn a new language. It’s about taking time to do other things so they’re not stuck under the grinding wheel of churning out charts constantly.
Chesca: I know that Axios is a relatively new company, five years old. Are there any significant changes that you’ve seen over the years?
Danielle: Two things stand out for me: Firstly, our size – the whole visuals team has gone from 6 to 20. When I started, it was me and two other people and our illustration team was also only three people. It’s great working with a team of this size for so many different reasons. Secondly, the tools we use have changed. We used to build almost everything in Illustrator, or D3 if we really needed something more custom, but now, we have bespoke internal chart builder tools, which are almost exclusively used by reporters. For us, we’re doing almost everything in Datawrapper.
Chesca: Can you share with us some of the projects you’ve worked on and the behind-the-scenes of how they came to fruition?
Jacque: One piece I’d love to share is this piece we made that commemorates the United States hitting 1 million COVID deaths. It’s not a super fun topic to write about, but it was a milestone that we knew was going to happen and so we needed to be prepared for it.

This piece initially started through a Slack conversation with myself and Jared shooting around ideas and progressed to looking at how other newsrooms approached the idea of visualizing big numbers. It came down to two approaches: Do you focus on the idea of 1 million as a big number, or do you focus on the individuals that make up that 1 million?

Jared put together a huge scrollytelling piece of what 1 million individual figures would look like, and we scrolled through it, and on my phone it took me almost 10 minutes to get to the bottom! So we took another approach where we decided to focus on how we put these numbers into context. We looked at historical events and populations, so we could compare the number of deaths to the number of lives lost in World War II or the Civil War or the population of San Francisco, and we began to lay these out.

We mocked things up on sticky notes, in Figma, or whatever tool we had available. We brought in Kavya to lend her design skills. We had to figure out how to polish and tighten it, and how to take a full-page visual and put it into a “smart brevity” newsletter version. The vast majority of Axios’ audience gets content through email newsletters, so you can’t use scrollytelling.
We also worked closely with Maura Losch, one of the illustrators on the visuals team, to come up with the header image, which was a personal highlight for me. She started with sketches that were very COVID- and virus-focused, like the spike proteins that we’re all familiar with now, but we wondered how we could humanise it. Maura came up with this smart idea to do vignettes of COVID life scenes.

Maura Losch’s initial hero image sketch for the 1 Million Deaths infographic
The final version included lots of people in masks, people washing hands, people in hospital beds and so on and so forth. This was a really collaborative piece. We started discussions, I think, in the beginning of February and it launched May 9th. Even though it’s a long piece, it works with the Axios format. The written text is quite short, and we leaned on the visuals to get across what we wanted.
Chesca: Amazing, that’s such a fascinating process to watch it all come together. Do you have another project you want to talk about?
Thomas: I have an example of one of our deep-dive projects. We had found a researcher who had US county-level data about current distances to abortion providers and how an abortion ban would change those distances, so we decided to visualize it.
When we saw that Roe v. Wade [the court case that legalized abortion in the US and was recently overturned] was coming back on the docket, we started looking at the projected map. We had the idea that you could show both sets of data: the current situation and the projected situation with one toggle on the visualization. And this is the beauty of our team – I put out that first iteration on our Slack asking for comments and got a message from Jacque who suggested having the toggle on a 3-second loop rather than making people click on it—which was perfect, as that’s totally what smart brevity is! We can tell the story in three seconds. It’s a powerful way to tell the story and super understandable for everybody.

Jacque: Something I’ve struggled with solving is, how do you deal with the newsletter issue of not being able to include interactivity? How do you get all the information that you would normally bury behind a hover or click and make it accessible to people?
Danielle: I think that constraint forces us to stick to data viz best practices. One of the challenges of being a data viz professional is knowing what to cut out. Everyone wants to put everything in. We have this conversation with reporters where we challenge each other to bring it back and only show people what they need to know. What does the reader actually need to see? The newsletter constraint forces us to distil it down to the most important parts. We view interactivity as a bonus.
Kavya: A static first mindset can often make for better dataviz.
Will: We don’t always do COVID infection rates and abortion maps, this next project came from us looking for opportunities to blend illustrations into our charts. You can argue that sometimes it’s functional, like icons in our deep dives, but sometimes you can add illustrations just to add some fun. Not only for us so that we don’t lose our sanity, but also so that our readers are engaged and find it entertaining to read.
Anytime we can make a bar chart into an item of food, we go for it. We’ve done hot dogs. We’ve done ice cream. We’ve done butter, Christmas trees, the Washington Monument – we’ve done them all. They’re such a fun way to break up the work. My job one day was to just Google dogs and cut them out in Photoshop.
Danielle: Anytime someone has a ridiculous idea, we encourage it. We enable each other to do stupid stuff.


Kavya: I’ll share another chart as an example of collaboration within our team. This chart had about six pairs of eyes on it, which really strengthened it. The first version I shared works, but it doesn’t have the impact of the one on the right. I know for me, I get better at data viz when people check the data, check the visuals, check the storyline. One aspect of our great culture is that we post early and often to the rest of the team.

We probably shared 100 messages about a chart in our Slack channels. But what’s really important is it’s a team effort. At Axios, we understand the line between giving useful edits and letting people make their own decisions about something. If I ask “Should this be a bar chart or a line chart?”, my teammates will tell me to follow my heart, and do what I think is best. There’s that level of trust that grows you as a designer.
Will: Something I’ve learnt over the years is that anytime you publish charts, especially when they’re visible to millions of people, you’re going to get a lot of different opinions and feedback. People are going to say, you didn’t do this right; you should have visualized it this way; this was the right chart to use, etc. Our response is always, basically, that there’s never a correct chart to choose. You can visualize things in any number of ways, and it just depends on your audience and what you’re trying to show.
Danielle: Exactly, our target audience is going to be different from the Washington Post’s or Fidelity’s.
Chesca: The mission of DVS is to support people looking to professionally work into the field of data visualization. Do you have any tips for aspiring dataviz designers?
Jared: Something I wish I would’ve taught myself earlier is that you don’t need data experts to edit your stuff. If you are a new designer and you don’t have an army of dataviz people around you to ask, that’s fine – lean on your peers, your cohort, your roommates, your friends, whoever it is around, and just get more eyes on your product.
Will: If you’re interested in getting into data journalism, visual journalism, there’s so many different roles in newsrooms that you can take. There are people that are generalists, that have a little bit of everything or specialists or there are people like we have hired people that mainly focus on design or coding. There are newsrooms where you don’t have to code at all for your job, where you can just design pieces in illustrator and data wrapper. Don’t limit yourself by what you think a visual journalist is.
Danielle: You can’t underestimate on-the-job training. Your growth rate and what you’re learning just goes up and up when you’re surrounded by it.
Jacque: I did quite a few informational interviews with different newsrooms which was really helpful for me to know you don’t need to know it all. All newsrooms are looking for different things and the way they organise their teams are very different and the team culture is all very different.
Thomas: There’s a lot of people who have imposter syndrome or underestimate their own abilities. But you have to trust yourself and just throw yourself at something to see how far you can get. That’s where I learned the most.
Chesca: One last question: what graph best suits your personality?
Jacque: I would pick one of those ridiculous spaghetti line charts – I have a lot of feelings and opinions.
Jared: Some overly complicated D3 chart. I often like taking the cool but complicated approach to things.
Danielle: Sankey, I like to go with the flow and be impossible to read.
Kavya: I’d go with the lollipop chart because it sounds funny.
Thomas: I’d have to go with a bar chart, because sometimes you can be fun, but most of the time you’re just old, reliable and kind of boring.
Chesca: Thank you so much for your time, it’s been super interesting hearing about your workflow and the culture of your team at Axios.
To read more about Axios and their team, visit Axios.com/about.

Chesca Kirkland is an Information Designer at Set Reset, a design studio helping people reimagine how they see, experience and interact with data.
To see more of her work, follow her on Behance and Instagram.
- Chesca Kirkland

- Chesca Kirkland

- Chesca Kirkland

- Chesca Kirkland


