
This article is part of a series that illustrates how basic design principles can improve information display. The previous installments focused on understanding the audience and context for your chart, and its core purpose. Here, we will take a look at how those considerations affect content decisions for the dashboard that we began redesigning in part 2.
As a first step toward redesigning the charts and information display, today, we’re going to focus on understanding the audience and purpose for this dashboard. Let’s take a look at a few key questions to better understand what we should consider in our dashboard redesign.
- Who is your user?
- Why are they interested in what you have to say?
- In what context will they see your visualization?
- Where are they coming from, and how is their experience likely to affect their response to your ideas?
- What is your purpose for this chart?
- What are you trying to accomplish, create, or convey?
Of course, we’re not the creators of the original dashboard, so we’ll have to make guesses about their purpose and intent, but we can use the existing design to look for clues about what its designers were trying to achieve.
(Note: If you happen to be lucky enough to have access to the actual dashboard creator, this article has some great tips on how to structure the conversation.)
Audience
At first glance, the audience for this dashboard is fairly clear: it is presenting statistics about a school district, so you can be pretty sure that it is intended for people who want to know how the school is doing overall. This description could include teachers who work in the district, parents whose children attend these schools, or decision-makers in charge of ensuring that the schools and students are doing well — or perhaps all three. A different dashboard could even be created for the students themselves, but based on content I think this one is unlikely to have much appeal to individual students. Each of these audiences would create a different emphasis for the dashboard, because each group probably cares about different things.
The data presented is fairly technical and focused on testing and other administrative benchmarks, so I’m going to guess that this dashboard is aimed at school administrators rather than teachers or parents.
Observations on Content and Context
Looking more closely at the details of the data displayed can give us more clues into the context for this report and about the school district overall. In this section, we’re just going to make observations about what is in the report; we’ll talk about the complexities of interpreting this information later.
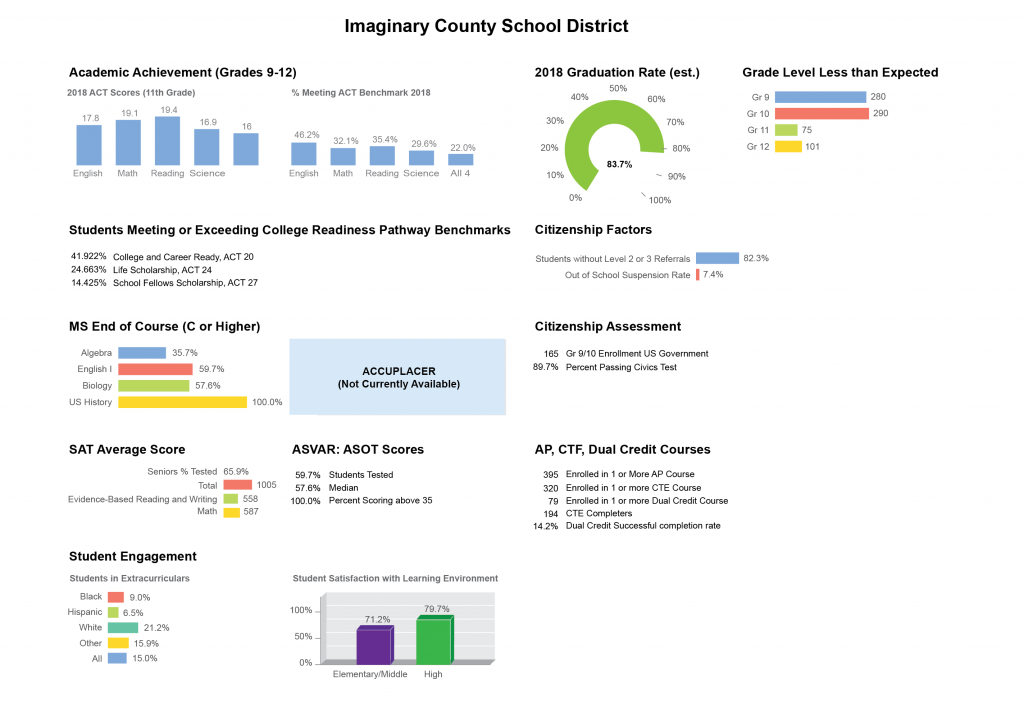
- The dashboard is focused heavily on core curricula, and does not present achievement information for classes outside of the standard areas of focus.
- The district does have an Advanced Placement (AP) program, but it has low success levels for the only metrics reported: 14.2% of students complete dual-credit courses successfully, and just over half complete the Career and Technical Education (CTE) courses.

3. The college readiness and course performance benchmarks are also low, indicating that this is likely a district that is struggling. Only 35 percent of the student population is performing well in Algebra. English and Biology are similarly low. The only exception is U.S. History, which implies that this may be a particular strength for this district. Or, there might be differences in student interest, course material, or grading practices. Whatever the reason, history is certainly an outlier in this dataset.

4. Standardized testing scores also reflect low academic performance, with average scores at around half of the possible points, and only around a third of students meeting the benchmark score.

5. The graduation rate is fairly low (just over 80 percent), and mirrors the student satisfaction statistics. Interestingly, student satisfaction in high school is higher than in middle school, and the number of students below their grade level drops dramatically in grades 11 and 12.

6. Extracurricular participation is fairly low overall, but particularly among Hispanic and Black students.

7. The presence of citizenship factors displayed so prominently on the dashboard indicates that the district may have a significant immigrant population, or perhaps that this is a particular area of focus for the school.

It’s also worth noting while we’re here that the order of presentation doesn’t really match the outline of points I just made. I had to jump around the dashboard to compare the different items, and there wasn’t a clear order to the information. It’s possible that I am missing something that would tie the initial layout together into a sensible sequence, but right now the content feels very disconnected and only very loosely grouped.
Purpose
Based on the contents of the report, it seems that the primary audience is most concerned with understanding how their school is performing against a variety of external benchmarks used to measure educational quality. It is interesting that the dashboard only reports metrics for a particular point in time, which implies that following long term trends and improvement is not a primary concern (or at least not the purpose of this report).
Overall, the dashboard contents reflect a focus on a set of basic standards. The report could be just a general district-health summary, or the individual metrics may be selected to reflect specific targets, focus areas, or initiatives within the school. To me, the fact that the metrics are measured at a single point in time suggests that these might be key indicators that the district is required to report on a regular cadence, perhaps for an annual meeting or statewide analysis. I would expect that a report focused on administrators in the district would be more focused on comparing to peers, achieving their targets, helping them see how they are trending, and where they can improve.
In general, the report is focused on helping the audience understand conditions for the student body as a whole, and in some cases to understand how many students are participating in particular programs and activities. Assessing the success of those programs may be a secondary purpose, but given the other information provided, it does not seem to be the primary focus of the report. The report is also not particularly focused on the success rate of individual students, or in understanding how these measures might be correlated within the student body (do students who are failing algebra tend not to participate in extracurricular activities?, etc.). Overall, it appears to be an overview of loosely-related indicators for a point in time, rather than a picture of the context of the students and the district over time.
Tasks
It’s also important to think about what a user needs to do with this data, and what kinds of comparisons they need to make sense of the information provided. Common tasks include:
- Understanding current status
- Placing information in context
- Comparing values (across programs and against previous performance, peers, and targets)
- Observing trends, patterns, and outliers
Within a chart, users are able to easily compare values using labels that the dashboard provides. Providing clear labels for every visual element on the page is one of the things that this display does best. This removes ambiguity and reduces the need to show chart axes (and it does not rely on the audience knowing how to read a chart). It also goes a long way toward making up for some of the more questionable chart design choices, but we’ll get to those in the next article.
Since this dashboard appears to be focused primarily on benchmarks and metrics, it is somewhat surprising that it includes little to no information about what those benchmarks are. It is possible that those values are simply known to the target audience: most people in the U.S. education system probably know that SAT subject scores are measured out of 800 points. Still, the dashboard tends to emphasize the score received rather than a particular target or goal, which either implies that the goals are not clear, or that the users are expected to know what they are and do the calculation themselves. I would expect that a district would at least have internal targets that they are trying to reach, but none of those are shown explicitly on the charts.
There is also no comparison to other districts or external standards, to understand what these numbers mean in the context of other schools (either peer or aspirational), or to state standards and goals. This makes it hard for a user to know what to make of the numbers: is an 80% graduation rate good? I think most people would say no, but it’s impossible to tell from this presentation.
If this dashboard is intended to be a report card of sorts, it might also make sense to show trends in the data over time, so that the audience can understand whether there has been steady improvement, or decline. We encourage children to see their grades in the context of their larger trajectory, and it makes sense to look at success of our educational systems in the same way.
Ultimately, this dashboard does a reasonably good job of reporting numbers as individual facts, but they are largely dissociated from the broader context, and from one another. It is not possible to understand how these different facts intersect for students in the district, or for the school itself. If the ultimate goal is simply to “know the stats,” then the dashboard does a reasonable job, but it doesn’t do much to put those facts into context or to make them actionable. If your purpose is to track change, identify areas for improvement, understand the student context or compare against similar schools, then there’s a lot more that’s been left out.

Statistics and Interpretation
Really thinking through what people need in order to understand and make sense of your data will help you to identify gaps, holes, and opportunities for improvement.
Right now, this dashboard lacks a sense of context within the statistics. For instance, there’s no way to tell how many students are actually in the district. The only raw numbers reported are for the AP and Dual Credit courses, which have 165 and 395 students, respectively, but that doesn’t tell you how many students actually attend the school.
Several metrics are given as specific numbers or percentages, without identifying how those counts relate to the general population of students within the school. This makes it hard to tell what the numbers mean. Presumably this is because the dashboard is used locally, and the dashboard designers assumed that people in the school system already know those stats. That assumption might hold for things like the total number of students, but things get a lot harder when you’re talking about percentages within a given student population or group.
It’s also not always clear what the percentages reported are based on: the percentage of students without Level 2 or 3 referrals could be based on the number of students who need them (therefore reflecting the school’s performance in meeting their needs), or based on the student body overall. In the latter case, this number mixes the student population size with the number receiving help, which muddles the results. Unclear definitions lead to ambiguity in how you interpret the numbers given in the report.

The same lack of context holds true for the ACT score results. ACT scores are measured out of 36 points, but I had to look that up to tell — it’s not given anywhere on the dashboard. Like for the SAT scores, that’s probably fine for education professionals who are likely to know the scores already, but it might be a problem for parents or others who are less familiar with that context. It’s hard to tell how bad a low score is without percentile information: it’s conceivable that everybody does poorly on that part of the test, and that a low score is simply normal. We get some additional insight from the fact that only about a third of students are achieving the set benchmark. It’s not clear whether that’s a benchmark for the school, the state, or for the test, but most students are not hitting the mark.

There’s also something interesting to note when you look more closely at the two ACT charts. Students scored highest in Reading for the raw scores (19.4) and a little lower for English (17.8). But in the benchmark data, English has a much higher percentage of students meeting the benchmark: 46.2%, compared to Reading’s 35.4%. This might give us some clues about the distribution of student performance on the test. Since the raw scores reported are probably an average value, it’s possible that there was a larger gap between students who did very well and those who did very poorly in Reading, so that a few high achievers pulled up the average but not the percentages. Or, there might be different threshold scores for the two subjects: perhaps a score of 10 is acceptable in English but you need to get a 15 in Reading. Again, this is probably clear to educators working in the district, but an outsider would need some additional help to know what these numbers mean.
Similarly, the AP courses table doesn’t give the percentage of students involved in AP and college credit programs; only the total. If you happen to know that the school has 500 students (I’m just making that up), then 395 students in AP courses seems like a great number. But if there are 1500 students in the district, then that value means something else. When we start talking about the number of CTE completers vs. those enrolled, listing just the counts leaves me to do the calculation in my head in order to figure out that just over half of the students enrolled actually complete the course (60.6% if you pull out a calculator). In general, it’s preferable to provide both the total count and the percentage value, so that I can see that 11 students out of the 79 who enrolled in a dual credit course actually succeed.

Note that there may also be something odd with how the district is counting these numbers, since 79 x 0.142 comes out to 11.2 students, and students aren’t generally measured in fractional values. This could just be a rounding issue, but I suspect that the completion rate refers to courses, not students, so that one student who is enrolled in two courses counts twice. If that’s the case, it would be interesting to see the distribution of students enrolled in a single course vs. multiples, and whether that 14.2% success rate really reflects just a handful of super successful students, rather than the population as a whole.
The dashboard also doesn’t tell you how many students are in each population overall, which is particularly important for the citizenship and racial distribution data. If we look at the extracurricular chart, it tells me that 9% of Black students are enrolled in extracurriculars, but it doesn’t tell me if Black students make up 5% or 95% of the population overall. If the school has 500 students and 5% are Black, that’s two students in extracurriculars. If 95% of that same school is Black, then 43 students are enrolled. We know that Black students can’t make up 95% of the population, because that wouldn’t leave enough students to make up the rest of the reported distribution for other races, but we don’t really have enough information to make sense of what’s going on.

You can get a little bit of additional context from the “All” bar at the end of the chart, but you have to work pretty hard for it: 15% of all students participate, which is the equivalent of 9% of Black, 6.5% Hispanic, 21.2% of white, and 15.9% of other student groups. If we assume that all of those groups are equally represented in the population (which we know is likely false), then we can treat the percentages as counts and add them up to calculate the total number of students in the school.
9 + 6.5 + 21.2 + 15.9 = 52.6
52.6 = 15.0/100*x
x = 350.6
This gives us the proportion, but not the absolute count. We can multiply by the smallest number necessary to get a whole number value, which gives us a (very unreliable) starting point of 1052.
350.6 * 3 = 1052 students in the district.
If we assume an equal distribution of students between groups, that would give us the following values. Note that only the numbers in bold are given in or calculated directly from the report; everything else is calculated based on our basic assumption.

We know that these numbers are unlikely to be correct. First, because demographic populations are not usually so cleanly divided, and second because the sum-checks in the third and 5th columns do not work out. If you assume an equal division of races, then each group has 263 students, and you can calculate how many participate in sports using the percentages reported in the dashboard. But when you add up those students, you find that the total doesn’t match what you would predict using the “all” category listed in the report. Fifteen percent of 1052 is 158 students, not 139, and the mismatch tells us that our assumptions are likely incorrect.
A more sophisticated calculation would account for the fact that the racial populations are probably not equal. If the population distribution is significantly different, the numbers presented above will be completely off. A whole lot of guess-and-check calculations in Excel led me to guesstimate the following values for a more realistic group of students (note that I did choose to round to whole numbers here).

This is really too uncertain to help us interpret the data, but it’s the only approach available, based on the information given. The bottom line is: without the necessary context of the demographic distribution and total number of students in the school, the percentages given in the report simply don’t tell us much. Unless you expect your administrators to have a detailed demographic profile for the school in their active memory (and to be able to do calculations like this on the fly), presenting numbers without context makes it hard for people to make sense of what they’re seeing. It’s always better to present both counts and percentages whenever possible.
Failing to present data in context often makes it impossible to identify root causes for individual problems. For example, returning to the grade level and student satisfaction scores, the data could support two radically different narratives.
The first is likely to be popular with the high school: students in elementary and middle school are less satisfied with the learning environment, and when students come into high school a large number underperform in their first two years. These numbers improve dramatically in grades 11 and 12, which could imply that the high school is doing a great job of catching up students who come in underprepared from middle school, and their performance really takes off in their junior year. Of course, it is also possible that grade 11 is when most of the low performers are simply dropping out. The school has an almost 20% dropout rate: if all of those happen between grades 10 and 11, that could explain why the overall performance metric suddenly increases, even though the remaining students may not have changed at all. Understanding more about the total number of students and how satisfaction is reported could help to solve this mystery. Right now, it’s not clear whether this data applies to the whole district and multiple schools, or to a single school that covers all grade ranges.
It’s worth asking: If you can’t even tell the difference between such extreme scenarios, how useful is this data? Providing context allows your readers to test out different explanations and understand connections — it’s what makes the facts valuable.
Expectations and Bias
In addition to making the dashboard less effective, leaving ambiguities in the analysis also creates opportunities for conscious and unconscious biases to creep in. It is extremely unlikely that people will do this much work to interpret the results shown in a dashboard; nor should they have to. If it’s not clear what conclusion they should draw from the data, people are likely to formulate their own, based on their underlying assumptions about what’s going on.
A school administrator might decide that the real problem is that history teacher who’s too easy on the grades, or that algebra teacher who’s far too strict. A teacher might say that student satisfaction is low because the class sizes are too big and a few unruly students make things worse for everyone else. The high school might say that it’s all the middle school’s fault, and the middle school might say that the high school is just pushing kids out. The state certification board might do a deeper curriculum dive and find that the school is not actually teaching 20% of the topics necessary for success on a standardized exam, but that the ones it does cover are taught incredibly well. A student or a parent might look at this and say that the school system has failed them, and that it’s impossible to succeed with the support provided.
A racist interpretation might attribute the educational results to the abilities, motivation, or internal characteristics of groups of people: a principal might say that Hispanic kids are just not motivated to learn, and that they don’t try to fit into the community by participating in sports. It is true that this dataset shows that Hispanic students participate at a lower rate, but there may be other causes associated with race, ethnicity or social class that create that relationship — it might simply be a symptom of other external conditions, rather than an intrinsic trait for that group.
An immigrant kid might choose not to play sports because he gets bullied and beaten up in the locker room for “talking funny,” and he’s afraid to be in contact with his classmates without a teacher’s supervision. A religious student might have youth group or church engagements after school, or might not be allowed to wear the uniform required to participate. In a poor family, a student might be working two jobs in order to support their family or save up for college, or maybe they don’t have a car to get home from sports after the late bus. A student with a large extended family might have caregiving or other family obligations that require all of their time outside of school. Without getting deeper into the analysis, it’s impossible to say which of these causes apply, but it is lazy and usually inaccurate to apply blanket explanations to an entire group.
To further complicate matters, there are usually many underlying causes for the patterns seen in data like this, and several explanations might be true at the same time. Many will apply to some students and not others, or to a single student at different times. This is why it is helpful to separate your observation of facts presented within the data from your interpretations. It makes those inferences more explicit and can help you to see where your assumptions should be examined, or where you might have gone wrong.
If you are really interested in solving the problem of improving performance in this school district, you’ll need all of that information to understand how to improve. Without it, it’s impossible to tell what’s really going on. This dashboard presents a snapshot in time of how the district is performing, but it gives little to no explanation as to why. It’s important to articulate that context in ways that the audience will understand, either through the dashboard itself, or other ways. As dashboard designers, we should always try to provide enough information and cross-checks to validate or contradict assumptions about the data—to help our audience draw informed conclusions from the information we present.
Recommendations
So, where do we go from here? Based on the observations and assumptions above, I would make the following high-level recommendations to the dashboard designer:
- Clarify your audience and speak to their specific needs.
- Provide more context for the values presented (e.g. reference values and total counts, clear definitions).
- Show targets and goals wherever possible.
- Consider including information about past performance, so that people can understand changes over time.
- Provide alternate views of the data, especially holistic pictures of student experience, demographic and socioeconomic factors.
- Consider additional data analysis or other activities (surveys, etc.) that help to identify root cause and make these scores more actionable.
Stay tuned for the next installment in this series, where we’ll take a closer look at the chart choices in this dashboard, and how they do (or do not) support a user task.

Erica Gunn is a data visualization designer at one of the largest clinical trial data companies in the world. She creates information ecosystems that help clients to understand their data better and to access it in more intuitive and useful ways. She received her MFA in information design from Northeastern University in 2017. In a previous life, Erica was a research scientist and college chemistry professor. You can connect with her on Twitter @EricaGunn.
Thanks to Raeedah Wahid for editing.
Originally published at http://ericagunn.com on December 12, 2020.

Erica Gunn is a data visualization designer at one of the largest clinical trial data companies in the world. She creates information ecosystems that help clients to understand their data better and to access it in more intuitive and useful ways. She received her MFA in information design from Northeastern University in 2017. In a previous life, Erica was a research scientist and college chemistry professor. You can connect with her on Twitter @EricaGunn.
- Erica Gunn

- Erica Gunn

- Erica Gunn

- Erica Gunn


