
One of my first data science projects was titled, Who Dies Next in the Game of Thrones?—a short article based on my data mining semester project that ended up circulating in the news. This happened in July 2017, right before the seventh season of the iconic TV show was aired. An essential part of the project was to build and explore the social network of the Game of Thrones (GoT) characters—which I couldn’t resist doing again, with the new spinoff series now out on HBO, and recently finishing the prequel novel, Fire and Blood, the basis of the new show. From all the promotions of the new series, it was obvious from the start: this one will be about dragons. A lot of dragons. But what does this look like in terms of the data?
Timeline of Dragons
Let’s start with a little history of Westeros, the realm that centers the fictional world of the HBO hit series, Game of Thrones, which was based on the A Song of Ice and Fire novel series by George R. R. Martin. At the beginning of the prequel book, Fire and Blood, we are about 300 years before the original show—the first year after the conquest (or AC, for short). This is when the reign of the dragons and the House Targaryen, the ancestral line of Daenerys Targaryen from the original HBO show, begins. First, Aegon, the Conqueror, and his sisters ruled Westeros, then they were followed by a few others, most notably Jaehaerys I, the Conciliator, later also known as the old king. The House of the Dragon spinoff starts with his problematic succession in 101 AC, which resulted in his much less capable grandson, Viserys sitting on the Iron Throne.
< SPOILER ALERT FROM HERE >
The turmoil around Viserys’s reign peaked when the matter of his succession arose, and ignited the chain of terrible events for the family known for its dragons and silver hair—the brutal war nicknamed Dance of the Dragons. While the new show has just aired its first few episodes, it seems to center on this internal conflict. It heads toward the ruling noble family splitting into two, resulting in a civil war that tore the seven kingdoms apart and marked the end of the dragon era.

These major historical events and the rise and fall of dragons are visualized in Figure 1. On the one hand, the reign of the notable rulers are marked by shaded areas. On the other hand, I measured the “dragon intensity”, as the number of references to dragons throughout the years—the number of times dragons were mentioned each year. For this, I used text processing to analyze the book and capture every mention of timed events (time measures after the conquest, as AC), and counted the nearby mentions of every word with “dragon” in it. Additionally, I also counted the number of mentions referring to known dragons, such as Balerion and Syrax (see the full list of dragons here). The data shows that the word “dragon” was mentioned 647 times, followed by “dragonriders” at 45, and “dragonlords” at 15. However, more than ten dragons have been mentioned more frequently than that—Balerion and Vermithor topping the lists with 73 and 66 mentions (Table 1).

The binned trend of the “dragon-intensity” in Figure 1 shows the indeed stable, peaceful time of Jaehaerys I. What’s even more interesting is how the “dragon intensity” goes up and peaks during and right after the reign if Viserys I, aligning to the tension building between the two factions of House Targaryen, as they fight to put their leader of choice on the Iron Throne after the king’s passing. After a peak with about twenty living dragons, this trend breaks when Viserys I dies, and the Dance of the Dragons begins. The devastating war eliminates most of the dragons, from which only four survived. From these survivors, by far the most notable dragon was Silverwing, who was first ridden by Queen Alysanne Targaryen, wife of Jaehaerys I.
Network of Dragons
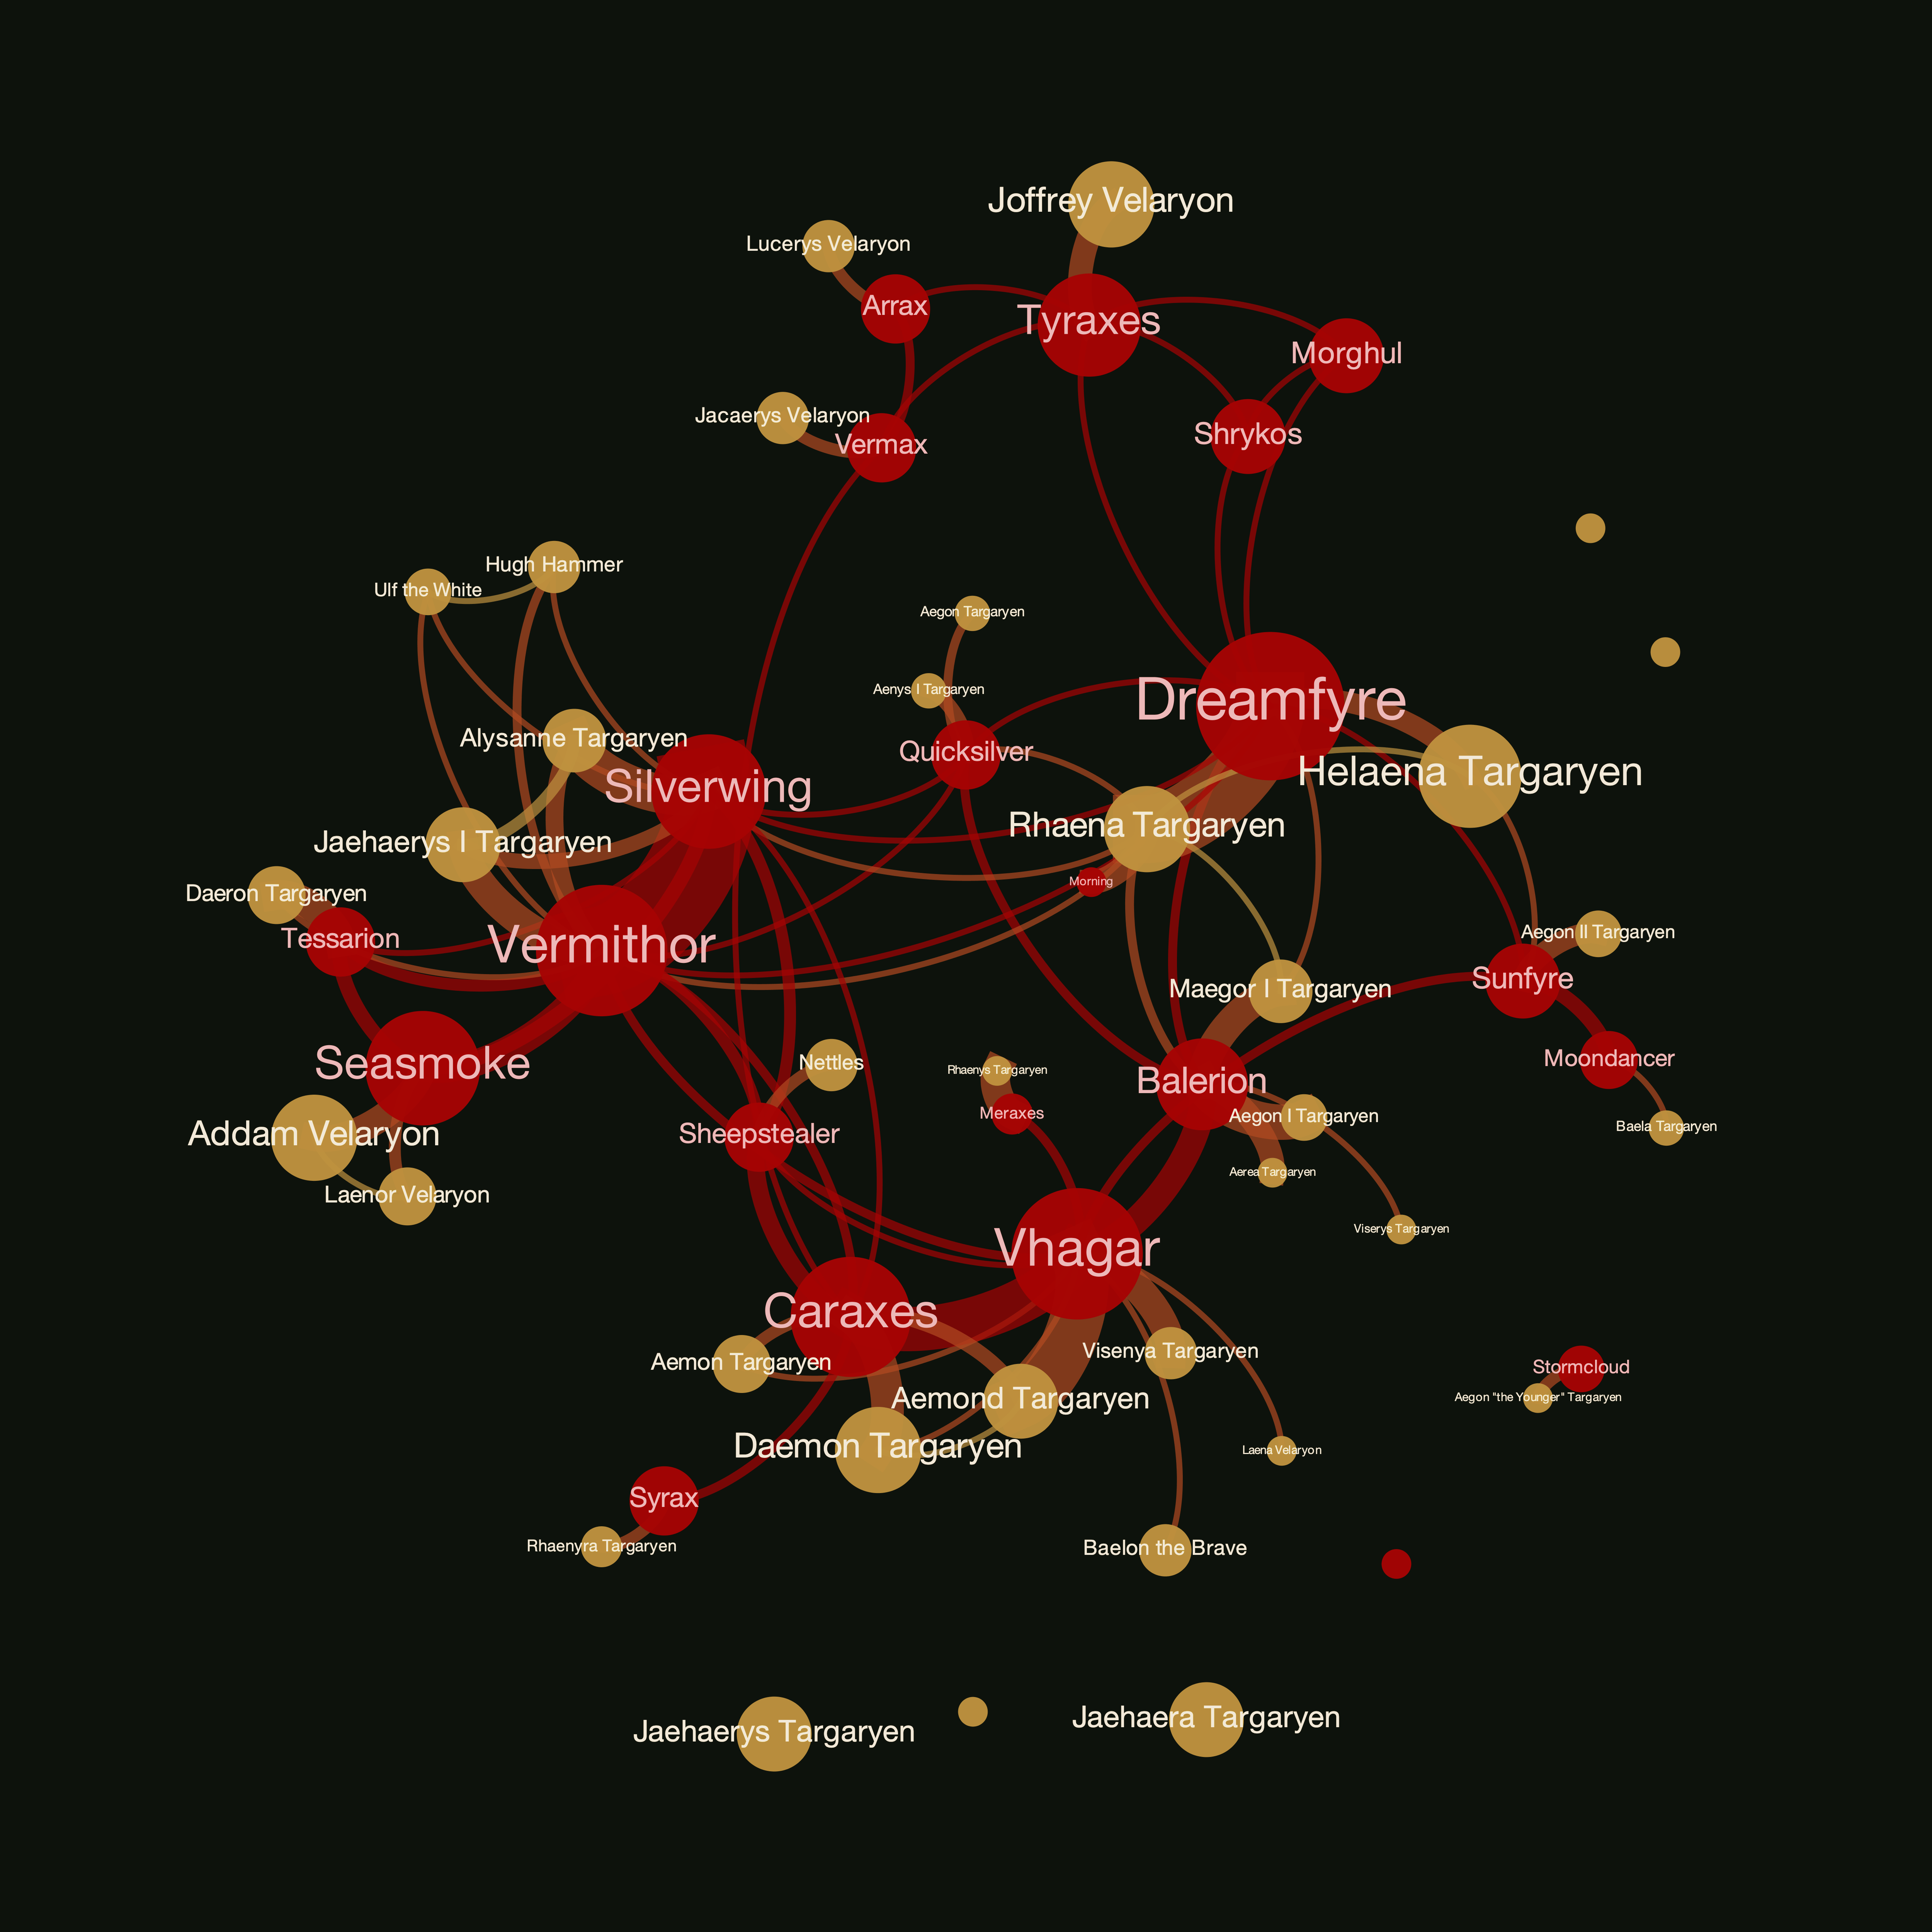
Finally, I built a network map of the dragons and their riders to outline the complexity of the plot with more than 20 dragons and even more dragonriders (Figure 2). In this network, dragons are shown in red, while dragonriders are visualized in gold, with each node sized to their number of mentions in the book. These nodes are linked if they are mentioned in the same sentence (naturally, riders are linked to their dragons).

While the Dance of the Dragons had the Targaryens split into two fractions—the blacks and the greens—this polarization is not visible in this network. Instead, it shows a mixture of events and characters, where the conflict emerges in more subtle details. For instance, amongst the largest nodes are Balerion and Vhagar, who were two of the three dragons that conquered the seven kingdoms. Their triplet, Meraxes, is visualized by a much smaller node, due to its untimely death in 10 AC.
As for the Dance of the Dragons, the blacks started recruiting so-called dragon seeds—non-Targaryen dragon riders, that resulted in the strongly linked triplet of Seasmoke, Vermithor, and Silvering—who was finally ridden again after Queen Alysanne’s death. Unfortunately, the first two dragons later defected to the greens. The blacks encountered another misfortune when their Dragonpit was attacked, with the dragons Dreamfyre, Shrykos, Tyraxes, and Morghul still inside during the riots in King’s Landing. Other, smaller nodes and less visible links tell stories too, such as the dragons Sunfyre and Moondancer, who fought in the skies of Dragonstone, where the much larger Sunfyre killed Moondancer, although Sunfyre also obtained mortal wounds and eventually died.
This article shows an example of how time series and network data can complement each other. On the one hand, the time series visualization, by extracting the overall arc of the new Game of Thrones, shows how the drama unfolds, peaks, and fades out. On the other hand, the network visualization allows us to zoom in and take a closer look at the major elements of the story by highlighting the most important actors and most relevant connections, from the two alliances to the first dragons and the largest battles.

With a background in physics and biophysics, I earned my PhD in network and data science in 2020. I studied and researched at the Eötvös Loránd University and the Central European University in Budapest, at the Barabási Lab in Boston, and the Bell Labs in Cambridge. I am currently the chief data scientist of Datapolis, a research affiliate at the Central European University, a senior data scientist at Maven7, and a data science expert of the European Commission.
- Milán Janosov

- Milán Janosov

- Milán Janosov

- Milán Janosov


