
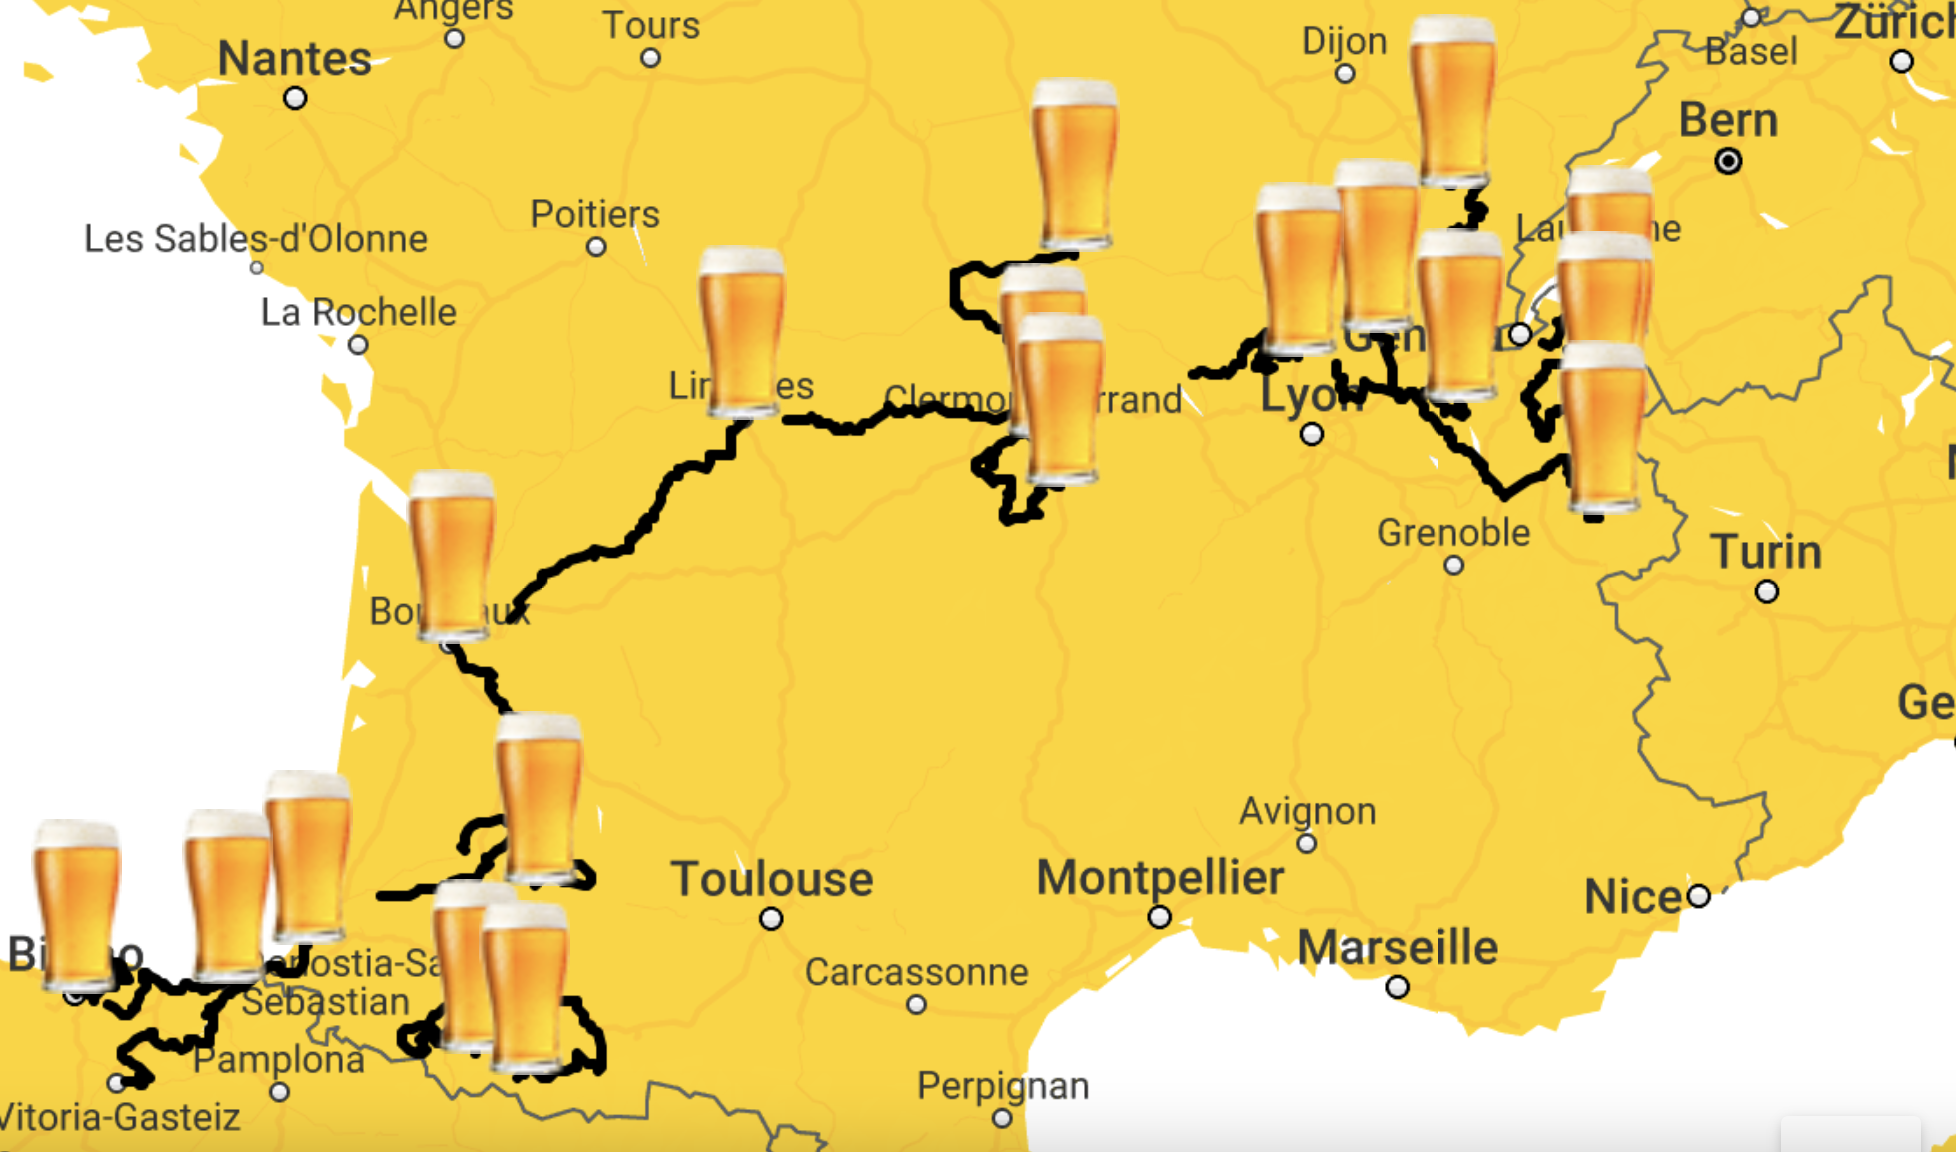
Inspired by Soonk Paik’s experience using GPT to build data visualizations, I decided to share my own journey in creating a cheap beer map for Tour de France. The objective was to modify Google Maps to display the pubs with the cheapest beer at the end of each cycling stage. This article documents the challenges, lessons learned, and tips for working with GPT-4 in the process.
And this is important: I am not a developer.
Challenges and Lessons Learned

The whole process turned out to be way more involved than anticipated. I expected to do a few prompts, maybe some design tweaks, and be done with it, but ended up spending three days of intensive development and debugging. I’m talking 12 hours per day with GPT-4 serving as my coach through it all.
Since I knew nothing, I also didn’t know just how much I didn’t know and that was hard to navigate at first. I learned about using the Google Cloud Console, how to work with a range of available APIs, and cloud-based map styles. One exciting feature that caught my attention was data-driven styling which allows dynamic map customisation based on data and it can be mapped to various map features and elements. I ended up setting the styles manually as I have a relatively straightforward map, but will definitely explore this feature for future use with more complex data layers.
It was a surprise to learn just how nested everything is in the code and that the data wasn’t just readily available to me. I imagined I’d give it a starting and ending location and it would plot the route on the map for me using directions API, but that was just me being naive.

For example, some stages start and end at the same place but if you add that into the map, Google automatically finds the shortest path—not the route that TdF actually takes. Just when I got desperate, I paired it with GPT-4 and got lucky by discovering this website with the exact route plot data I needed for Tour de France 2023. This is data I couldn’t find even on the official website since they had some god-awful map with no specific route details.
I couldn’t use GPX data directly so chatGPT guided me in creating a GPX to GeoJSON converter script as a little side project. We coded another tool later on that retrieved all the coordinate data via Google Maps API and then merged it with the existing GeoJSON file. This was done to prevent constant and needless calls to the API and make the map more robust by loading from a local file.
The Developer’s Role
Despite GPT-4’s assistance, a developer’s involvement was still necessary in the very end. For instance, a bug caused a blank map for some users. Initially, I considered potential causes like too many calls to the Google Places API or slow user connections, we tested different browsers, and platforms and found no consistent cause. Finally, I asked my developer for help and he resolved the issue by suggesting that everything be merged into a single .js file. This was a blind spot for both me and GPT-4.
Tips for Working with ChatGPT-4
- Ask for small modular code instead of large code blocks: This prevents the output from being cut off mid-output and reduces the need to constantly ask GPT-4 to resume.
2. Be aware of memory loss in long sessions: GPT-4 may drop parts of the code or lose track of functions over time. I actually restarted the development 12 times by pasting the latest code into a new chat session and asking GPT-4 to interpret it (to verify it understands it) and then review it (with a fresh pair of AIs, haha!)

3. Avoid feature creep: Keep the final visualisation minimalistic by focusing on essential features and conducting user testing before implementation.
4. While version 4 is slow, but still a better choice than 3.5 (despite the fact it’s lightning fast in comparison) because of its broader set of capabilities and better memory. For example, 3.5 keeps dropping the API key from the code considering it a security risk, despite me repeatedly saying it’s referrer locked and can’t be used by other parties.

5. Some dead-ends were caused by me. I would test the code, get an error or a blank page and then go back to GPT-4 and force it to find new solutions. When pressed it always yields but this can lead to errors and hallucinations. Later on, I found that in fact, the original problem was my cache and the original code worked as intended, but we went too far down the track and messed everything up trying to fix a non-issue, ironically causing actual issues.
6. Rolling back was easy as each prompt contains a branch selection 1/1, 2/2 and you can always go back to a converging point and resume from that point by editing my prompt. That was a lifesaver.
7. I often mess up code when pasting segments so I often say “show full code for filename.js” and copy/paste the lot into the code editor.
8. Sometimes the poor thing just needs a bit of encouragement. This is perhaps the most hilarious thing about it. (e.g. ChatGPT: I can’t do tables. Me: Yes you can. ChatGPT: Yes I can. Proceeds to make a table).

Final Thoughts
I am still super-pumped about all of this and feel as if the barrier to entry has been lowered to allow non-developers to go beyond specifications and dive into functional prototyping and experimentation. My ongoing challenge right now is that there is so much of it out there now that it’s hard to keep up.
Time to get some sleep I think.
I am an Australian digital marketer and the managing director of Dejan. If you have any questions or comments about this article please contact me on Twitter or at: https://dejanmarketing.com/dan-petrovic/
- Dan Petrovic


