
This is the second article in a series about Grafana. Part 1 was an intro, demonstrating how to create a simple static dashboard using Grafana, you can read it here. The tutorial continues in this article, where we will learn more about creating variables and make our dashboard more interactive.
In the world of data visualization, we hear about interactive dashboards all the time, but let’s first take a moment to define what that actually means here. A dashboard or chart that is considered static, meaning that does not have its data changed in real-time or through filtering (slice and dice), is commonplace and has its space: it can be used to support a paper or article, news in data journalism, a presentation or poster and so on. The objective is to show a snapshot of your data and tell a story.
But when you want to go beyond static information and allow your users to interact with the data itself, interactive dashboards provide you with controls that can help you to slice and dice the data, see the data from different perspectives and even draw your own conclusions.
The functionality in Grafana that will allow us to do this is variables.
To execute this tutorial, you’ll need to have completed the first part documented here, where we have created a very simple dashboard based on the data from the last Data Visualization Society survey.
Dashboard Variables in Grafana
Dashboard variables work as filters in Grafana, but they require a little bit of configuration to work when compared to tools like Power BI or Tableau. Nevertheless, the results are what we expect, bringing much-needed interactivity to your dashboard. To create a dashboard variable, you need to first enter into Dashboard settings, as marked in red on the image below.

Then, just click on ‘Variables’ at the left and you should see the list of custom variables (or a message if you do not have any variables) that you have added to your dashboard. Variables here work in a very similar way to that in programming languages, and we are going to use them to filter our dataset.

I’ll go through the finer details about variables creation in 2 steps: first I’ll show you a couple of those already created variables, and then, I’ll create one completely new variable and explore using it to add some interactivity to our dashboard.
Configuring custom variables
Click on the first variable of the list, the following screen will be displayed:

Variables should have a name — they cannot be duplicated and an error will appear even while you are editing. Next, we define the type. There are 7 types of variables, and I’ll focus on 4 of those types that are the most used ones. The variable in question is of Custom type. Custom type variables will be presented on the dashboard as drop-downs. As an optional configuration setting, we can set a label and if the variable will be visible or not. I had not set a different label for this variable, and I have set the variable to not be visible on the dashboard.
The next step is to determine which values we can select from. This is done on the Custom options section, on the field ‘Values separated by comma’. There, I’ll list all the possible values. I have typed just one value. The outcome of this configuration is a variable that can be used in the dashboard across all our charts.

Using Constant variables
Is this the best configuration for this variable? As a matter of fact, no it is not. To fix this, we will know our next variable type: the Constant. The constant is, like the name suggests, a variable with a value that does not change. The configuration is simple, and you can see it below.

As you can see, after I have changed the type to Constant, this variable gets simplified: we don’t have a label or visibility status. We just have the value to be set. For a variable that we don’t want to show in the dashboard, it is perfect. Its only restriction is that we need to type its value, we cannot derive it from our data source. You may be asking “why will I create a variable if I don’t want it to show in the dashboard?” — the most common reason for that is that you want a fixed filter with just one single value that you don’t need to change.
Using Query variables
Query variables are very similar to Custom variables, but with an advantage: we can retrieve the values that will be listed from a data source. And it is an advantage because the items present on this list will change according to your data. No more needing to go back to your dashboard to add more options.

As you can see by the image, a Query variable is of type Query, which will present us with a few Query options. The main options are the data source to connect to get the data, when this data will be refreshed, and the SQL query itself that will be used to bring in the data. An important thing about the query itself is that it should return one field, no duplicated values, and not too large a list, lest it compromise the performance of your dashboard.
There are a few other configuration items still. Regex allows you to filter the results based on a regular expression. Sort allows you to inform the sort order. Multi-value allows you to select more than one value in the dropdown when using the variable.
Practicing with variables
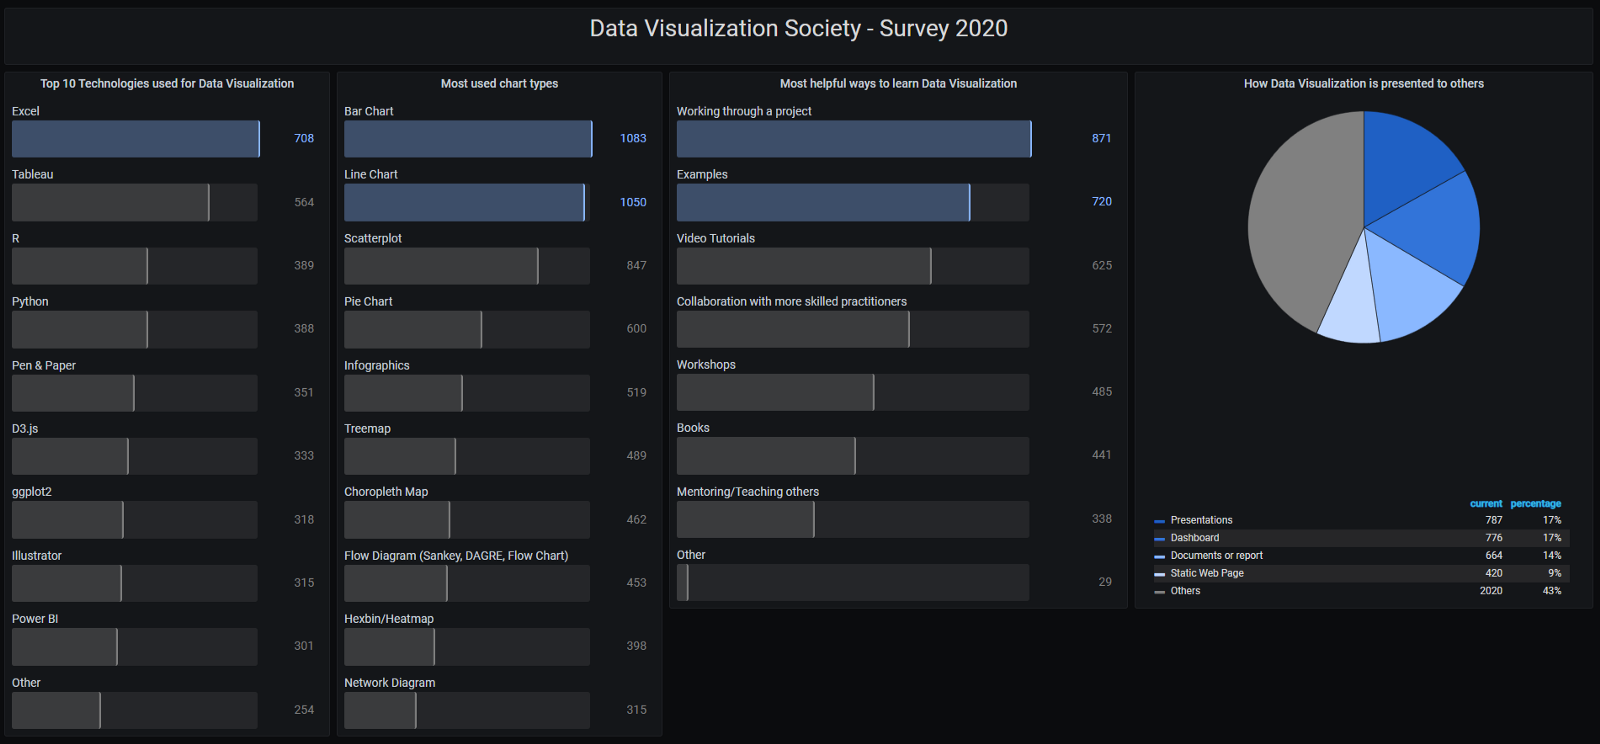
Now, let me show you how to put it all together. We are going to use a very simple dashboard, based on the data available from the 2020 Data Visualization Society Survey. On this dashboard, I’ll be able to see the results for each question and apply a few demographics filters. The idea is to create a utility dashboard that will allow us to see visually the results. An exploratory data analysis dashboard if you will.
The first thing to do is to ensure that you already have your own Grafana environment. in the cloud. Please follow the steps in my previous article to have the environment set, with a data source. The table that we are going to use is named SURVEY_DATA, and its structure is as follows:
id: integer() → unique identifier
respondent: character varying(100) → the scrambled name of the respondent
question: character varying(4000) → the question
answer: character varying(4000) → the answer
application: character varying(100) → the name of the organization
survey_name: character varying(100) → the name of the survey
load_date: timestamp without time zone(0) → date of the data load
category: character varying(4000) → the category of the question
1. Create and save a new dashboard

2. Create variables
Here we are going to create the application variable, which will have a constant value of DVS2020, to act as a filter.

The Question variable will be of query type and we will write the SQL to bring the distinct values of the field question. Observe that we are using the application variable as a filter.

Now, it’s time to actually build our chart. It will be a simple bar chart, with the following query:
SELECT answer, count(distinct respondent) as value
FROM survey_data
WHERE application = ‘$application’
AND question = ‘$question’
GROUP BY answer
The query above will return, given the 2 filters application and question (our variables), a list of its answers and the number of occurrences. Another thing important to notice is how we use the variables: the variable name should be preceded by the character $ and since they are strings, they should be enclosed in ‘and.’
The dashboard will turn out to something like this:

If you have built the dashboard, go ahead and play with it! Select a new question and you will see the distribution of the answers change on the bar chart. The next step is to add more interactivity, with a few new variables.
3. Configuring multiple select variables
One very common need that we have when analyzing survey results is to check how certain demographic questions impact the other data points. More often than not, we don’t want to select just one value — we want to experiment with some values grouped together. So, we are going to configure multiple select variables, as listed below:
- Are you a Data Visualization Society member?
- Are you currently looking for new employment opportunities?
- gender_collapsed (The gender question)
I created the first one as an example in the image below.

Going back to our dashboard, we can see the 3 new variables and how they appear to select values from.

However, even when we select a new value, nothing changes on the chart. Let’s fix that now.

The fix is simple: we need to create filter conditions on our chart SQL. To include the filter using the first question, we will write the following:
SELECT answer, count(distinct respondent) as value
FROM survey_data
WHERE application = ‘$application’
AND question = ‘$question’
AND respondent in (
 SELECT distinct respondent
 FROM survey_data
 WHERE application = ‘$application’
 AND question = ‘Are you a Data Visualization Society member?’
 AND answer in ($q1)
)
GROUP BY answer
Observe that we added one new clause in the WHERE statement, where we make a subquery that identifies the people that have answered with the values were have selected for that question. Now, we will repeat that for questions 2 and 3.
SELECT answer, count(distinct respondent) as value
FROM survey_data
WHERE application = ‘$application’
AND question = ‘$question’
AND respondent in (
 SELECT distinct respondent
 FROM survey_data
 WHERE application = ‘$application’
 AND question = ‘Are you a Data Visualization Society member?’
 AND answer in ($q1)
)
AND respondent in (
 SELECT distinct respondent
 FROM survey_data
 WHERE application = ‘$application’
 AND question = ‘Are you a Data Visualization Society member?’
 AND answer in ($q2)
)
AND respondent in (
 SELECT distinct respondent
 FROM survey_data
 WHERE application = ‘$application’
 AND question = ‘Are you a Data Visualization Society member?’
 AND answer in ($q3)
)
Note this query is not perfect — hardcoding the questions in each filter is not the best alternative — but it does the job. So, I’ll be pragmatic for now and leave it as is.
So there you have it — in this article, you have learned what variables are in Grafana, their types, and how to configure them. You’ve also learned how to use those variables as filters, providing interactivity to your dashboards. If you want to see the final version of the dashboard, just click here.
Cheers!

Walter Ritzel Paixão Côrtes is a product designer and data visualization practitioner who works solving users problems through a data-driven approach.
- Walter Paixão Côrtes

- Walter Paixão Côrtes

- Walter Paixão Côrtes

- Walter Paixão Côrtes


