
There’s much to be told in the story of the Isotype. The International System Of Typographic Picture Education (ISOTYPE) was invented by Otto Neurath in collaboration with his wife Marie Neurath, and Gerd Arntz. While assisted by many, this core Isotype team sought to create educational designs to bring statistics alive through a visual language of modular pictograms. In 1925, Otto founded a museum in Vienna for educating the public on social and economic issues (Gesellschafts- und Wirtschaftsmuseum) with the motto: “It is better to remember simplified images than to forget exact figures.”
While many have discussed and explored the team’s work over the years (to which I have recently tried to shine a light on the pioneering role of Marie Neurath in particular) it is also common to be a little confused about what an Isotype actually is. More so, the story of the Isotype begins in the mid-1920s and spans all the way to 1971 when Marie retired, so there is a lot of work to consider.
What better way to learn more about Isotype and gain inspiration from their designs than to view and discuss the work itself?
This article — part of a series on Isotype — seeks to explain and celebrate the work of the Isotype Institute while revealing the process and design concepts used to create it. By focusing on the books published by Adprint from 1941–48, I want to explore the techniques and mindset behind each chart and the system behind the combined series in order to inspire new information design concepts today.

Isotype Institute: Creating A New Life in England
As I discussed in my last article, Otto Neurath and Marie Reidemeister were ensnared in a British internment camp after they fled the advancing Nazi army in 1941. They quickly married after they were released, and a year later, Otto and Marie co-founded the Isotype Institute. That same year, the Isotype Institute found an important collaborator with a book packaging company called Adprint.

Founded by a fellow Austrian, Adprint’s collaboration with the Isotype Institute led to the creation of a number of books that promoted cultural understanding between Britain and its allies during the war. As the war was still in full swing, Adprint and the Neuraths collaborated with the British government to create two series of books that featured Isotypes: “America and Britain” followed by “The Soviets and Ourselves”. Each book was by a different author and the Isotype charts have no real overlap with the writing in each book (other than the general subject matter) so the Isotype Institute was given additional credit as authors on the cover.

They began working on the charts for the book series — Otto in research and Marie in ‘Transformation’ (a skillset using research, data science, and design process) — but as they were working Otto suddenly died, presumably of a stroke. Now, on her own, Marie writes in her memoir “I had to carry the work on, and I had to take final responsibilities myself.”
A transitional period in the evolution of Isotype
This series of books represents an interesting moment in the life of the core team of Otto, Marie, and Gerd. In 1940 Gerd Arntz, a German-born artist who helped refine the aesthetics of Isotype by applying his modernist design sensibilities chose to remain in the Netherlands as the Neuraths fled the war. The Neurath’s retained basic design elements from the years of collaboration with Arntz — and indeed agreed that they collectively ‘owned’ the work — but did not have contact with him for a few years after they settled in England.
This series of Isotype charts in these two book series is, in some ways, the pinnacle of Isotype design. Otto and Marie’s collaboration on these books would have been some of the last projects that Otto worked on before his death and also shows the first steps by Marie in evolving the form and visual language of Isotype. The line between what was planned and designed before and after his death is something I couldn’t find details on. Otto was alive for the duration of the design and publishing of the first three books in the series “America and Britain”. The second three books in the “The Soviets and Ourselves” series were completed by Marie and her new team.
The First Lesson of Isotype: Qualitative and Quantitative
The first concept to understand is that Isotypes often mix qualitative and quantitative data. By simplifying the concepts trying to be communicated (often qualitative) and then elaborating with pictograms (quantitative), Isotypes aggregate both types of information into an easy-to-understand message. Of course, they do this in many ways so we’ll examine just how they do this in the examples below.
Only An Ocean Between, 1943
(Images from Thom White’s Blog, cover from Eagereyes, and author’s copy.)


The first book from the “America And Britain” series was written by Lella Secor Florence, an American pacifist and feminist living in England. It was created to educate the people of both countries on the differences and similarities in geography, climate, population, and touches lightly on infrastructure and business. It contains some of the more iconic Isotypes that we see referred to regularly in books and online. Of the three books in the series, it focuses the most on the cultural commonalities and comparisons between the two countries.
It is important to point out that while many of these images and charts have been shared, few of them have been actually discussed for their content. That said, noted dataviz historian Robert Kosara also covered this Isotype book (and others) with a number of keen observations and shares a passion for explaining the nuance of the work itself, so check out his work if this is interesting for you. Hopefully, others will join in too, as there is so much work to explore and discuss.

The first Isotype in the book is a map of Great Britain, which includes the whole of England, Scotland, and Wales, but not Northern Ireland. It has one of the few indications to the actual text of the book, with the names of landmasses, rail lines, elevation, and some special locations added for good measure.
Like most Isotype charts, this map’s function is to get the reader acquainted with the geography and infrastructure by simplifying the information it portrays. Interesting to note how the locations, transportation, and elevation are mixed in the map above. The detail for each is reduced to show the proximity and location while still surfacing the relative complexity of the map. Certainly, we are culturally used to seeing multi-dimensional maps, but the selected focus in these two maps is consistent with how the other Isotype charts ride the line between simplicity and complexity.


Like the Great Britain map, the map of the United States provides a high-level geographic understanding of American cities, topography, and rail lines along with locations of importance referenced in the text such as the Boulder Dam. It acts as a sort of meta-legend to orient the reader to the places and scale of the United States. The subtlety in the color and linework in signifying the difference between natural and political borders shows the care used in crafting it.
Like the map of Britain above, this map also shows a selective focus and attention to presenting information in larger units. By only displaying the rail lines which enabled western expansion, they show the massive distances covered, and touch on the preponderance of track in the eastern third of the country in a subsequent map. The elevations on this map are also reduced into three groups: low, medium and high to indicate a broad understanding of the regional differences. Lastly, the distance legend also breaks up its 500-mile length into five units reinforcing the visual vocabulary.

By grouping both countries under the title “Our Weather” it shows a unity between the 2 countries despite the huge difference in the range of temperature changes, across seasons, and the natural phenomena that influence them. In the US, we see 2 blocks representing Winter and Summer, with Minneapolis and New Orleans plotted as extremes and New York City tucked in the middle. The arrows to the right literally point out the differences in latitude and double as diagrams of the warm Gulf Stream and arctic Labrador current off the American coast.
While more data could have surfaced in this chart, the Neurath’s focused on two seasons (hot and cold) linked to three US cities/regions (hot, temperate, cold) broken into four temperature units. The use of color is systematic — freezing light blue, cool blue, warm yellow, and hot red — showing the overlap between countries, and is also applied to the arrows reflecting the weather influences as well. The text below the chart reinforces the message and links the two climates which, on the surface seem very different, but are actually linked by global conditions.


“Our Weather” shows a comparison between the temperature and rainfall in London and New York. The text at the bottom explains that contrary to the stereotype, NYC actually gets more rain by volume than London, while London is certainly more overcast.
The Isotype system is again applied to create an efficient and logical diagram. The color scale continues from the previous chart, showing the four temperature ‘strips’ with the dual thermometer shapes representing the minimum and maximum temperatures in black for each. The 12 blocks represent the months per year that it regularly rains in each city while the density of the diagonal lines represents the flow of rain.
The page design is also laid out like a table, with the two cities aligned to the left, labels right-aligned in the center, and the diagrams on the right. This information architecture supports an easier comparison between the different types of data and creates a clear story that belies its complexity.

One of the more well-known Isotype charts is “The Ocean Shrinks”. It shows the time gains in travel via technology from a historical perspective but does so by creating the unusual metaphor of a shrinking ocean. The ingenious label on the row with the airplane explains that each wave represents one travel day, which helps the reader understand the chart as distance per unit of time. So distance collapses into time and the ocean indeed shrinks.
The shrinking distance also reinforces the growing ‘closeness’ of the two countries and cultures. The subtle update across each of the four time periods in the illustrations of London and New York also creates visual interest and adds nuance to the progressive story. (By the way, the archaic spelling of ‘to-day’ is just unusual. Otto was known for his many typos and grammatical errors when corresponding with friends)

The two pages above (presented together but not like this in the book) flip the perceived narrative about connectivity and transportation. While the US is considerably larger than England, its smaller landmass allows for its rail infrastructure to be more interconnected than the U.S. by almost 100 years.
The detail on the train illustrations is approximate yet informative. Sporting a modernist flat aesthetic, each engine reflects a typology of train design per era for comparison. The shade of red on the brown-grey for the maps and the pure red for the train helps tie the whole design together and affords a connection between the two.

“United States and Great Britain in the World” shows a greatly aggregated view of the entire population of the world’s population by race. The design is segmented by a combination of country and region and the racial makeup has been grouped into five categories, by color, each displayed by a customized icon.

The team regularly recycled this design to ensure that the data or story being discussed was considered with an understanding of the statistical racial footprint. The above chart is a design that the Isotype Institute had been iterating on since at least since 1932, as seen in the publication that matches the name of Otto’s museum in Vienna, the Gesellschafts- und Wirtschafts on page 23.
Otto Neurath fiercely opposed any kind of racism throughout his entire career. While the icons in this Isotype chart representing the races of the world do not fit in our cultural norms for inclusivity today, Neurath’s intention was exactly the opposite at the time. The fact that Neurath represented the non-white population was a radical concept, as the very existence of these populations were regularly ignored. Then, by showing the white, western world that they were not the majority, Neurath challenged the notion of cultural supremacy held by many academics but especially by Nazi Germany. The icons themselves are not unequal in any way and the white population is outlined as to visually recede into the background. While the Isotype Institute was focused primarily on presenting facts, they did regularly display a certain educational agenda — likely originating in their leftist intellectual involvement in “Red Vienna” in the years before WW2. While the updated version of “Only An Ocean Between” is nearly identical to its predecessor, it has been further reduced to show larger regional groups with fewer icons overall. By pointing out the surprising statistic on the corresponding black populations and also referencing the scarcity of Native Americans in the US, Neurath points out the racial inequality in a subtle but pointed way. Fellow Nightingale writer Paul Kahn also points out that the chart was a product of the Colonial world, by grouping the brown half-icon for the Philippines with the US population as it was a US colony at this time.

The United States is a big place and “Area and Population” shows just how big and sparsely populated it is by comparing each region to other countries of comparable size and density. You’ll notice that the unit of measure (100K square miles) is consistently applied across all countries, it’s layout is a sort of small-multiple with the population overlaid on each. By coloring the US as Blue and Britain as Red it keeps the focus on each while including the grey for global comparison.

The above diagram is a type of map that is unique to the Isotype. It shows the shape of the country with three cross-sections showing the altitude of the landscape plus the kind of vegetation or crop that is known for that region. Turn the page and you’d see the US version below, note the matching colors and icons for both maps.


The American version of the same map shows a different picture in terms of scale and natural resources. An expanded series of icons represents a generalized layout of major crops, mountains, and forests. It’s clear that the US has vastly more natural resources than England but the range of resources is also clear. The design helps to convey a tremendous amount of information very efficiently. Imagine seeing an Isoline map displaying the same data; it would provide a more granular view of the data but could only display a single aspect, the altitude or the vegetation/crop but not both.
Like everything in the Isotype system, every aspect of the map is reduced to convey the general information. The brilliantly reduced legend is no exception, showing only a horizontal line for length and a right triangle for altitude. The legend integrates into each map very perfectly and matches the general understanding that is intended.
Comparing the maps requires attention to the details as the 5:1 ratio reveals they are not on the same scale. While the legend is clearly labeled, we don’t register the difference in the scale because we are not looking for that kind of comparison. As readers, we are only looking for general locations.


Because of their past in creating museum exhibitions, Otto and Marie often created Isotype charts to be read in sequence. This Isotype chart builds nicely from the preceding map by exploring the role of farmers and the land. Likewise, it also borrows a similar design (by unit) as seen in “Area and Population” before the maps. The scythe icon on each figure had been previously used by the Isotype Institute to represent agricultural workers but this chart introduces it for the first time in this book.
“Farm and Farm Workers, 1935” compares three types of workers: farmer (black), working relatives of farmers (blue), and hired labor (red). Each icon represents 100,000 workers, each cell represents 100,000 farms assorted into groups of five. While it takes a second to read the chart, there are two immediate understandings: that Britain has far fewer farms than the US, but hires far more laborers per farm. The text at the bottom explains the details.

We’ve seen how Isotypes group and organize both qualitative and quantitative data in the charts above. “Population and Live Stock” is a great example of how the design of the grouped icons helps to reveal the story despite groups that are very different sizes.
The focus of the chart is not the overall size of the populations, but a subtle insight to tell a more interesting story. By breaking the larger US population into three equal rows, it helps to make a more natural comparison between all four rows. Paul Kahn adds, “UK population in 1939 was 47.5M. US population in 1939 was 130.9M. This chart simplifies these numbers to emphasize the 1:3 ratio. So you can see there are three times as many Americans who eat less sheep and more pigs and cows.” Marie Neurath’s work as the Transformer in collecting the data, calculating the story, and designing its layout is complicated when you think about it, but the ultimate simplicity of the design makes it simple and elegant. Comparatively speaking, the British rely more on sheep than the US.
Every detail of an Isotype chart is considered — even the direction of the icons. Having the animals move in the direction of the X-axis (from left to right) it helps establish how they are read, both in the same (visual) way that we read a horizontal bar chart, but also (conceptually) that the animals are an independent population from the people. Had the animals faced toward the people it might have a different meaning as animals in line to be eaten — but that’s a different chart in a later book in the series.

“The World’s Merchant Marine” helps us to understand just how many ships the British Navy has in relation to the total number of ships globally. It also helps us understand the quantity of coal-burning (black), “oil-burning” (green) and wind-powered by creating icons for each. The 6×7 block of British ships in 1914 becomes the predominant group of measure, showing not only how the British Navy was equal to all ships in the world minus the Americans, but also how they modernized their fleet by 1939. The chart is easy to make comparisons not only between the two countries in focus but in the context of the entire world’s fleets.

This is another favorite subject of Otto’s, having created a similar version 11 years earlier in 1932. In the earlier version, the extended flags created a sort of diverging bar chart to show the rapid growth of the American Navy. The ship icons below each bar represent 5 million gross tons (instead of 500,000 in the one above) and the story is not only the growth of global shipping but the strength of the British and American navies.
The difference between “The World’s Merchant Marine” and the earlier 1930 version (at left) is significant in two ways. First, it tells a different story by focusing on the growth in the tonnage of ships over 79 years. By visualizing the icons as 5 million tons we see a more easily compared “bar” of ship icons that are equal in color with more fidelity in nationality. Second, in the earlier version of the chart, it shows the growth of the American Navy, whereas the latter shows the massive power of the British Navy. Because of the comparison between the two versions, we can see how important the layout and quantity of the icon units are to interpret the message.

Isotypes were often criticized for the data that was omitted or aggregated. The left page, “Imports and Exports per Head, 1935” would certainly be an example of why. We are presented with two diagrams comparing the total average person’s imports and exports for both countries. While it is easy to see the difference, it is not very easy to understand what the arrows represent, made especially more troubling by the lack of numbers. Sure, the text below explains that Americans are far more self-sufficient and that the British ultimately manufacture the vast majority of their exports, but the scales are too mysterious.
The right page, “Power Used per Head, 1935” is easier to scan, and shows a snapshot of global energy use by type (oil, coal, and hydro). The countries are ordered by longitude, North America first, then South America, Europe, then the far east. The inclusion of hydroelectric is likely a nod to the increases in the American infrastructure as a result of the Public Works Administration which the Isotype Institute explores in the 3rd book in the series, “Our Two Democracies At Work”.

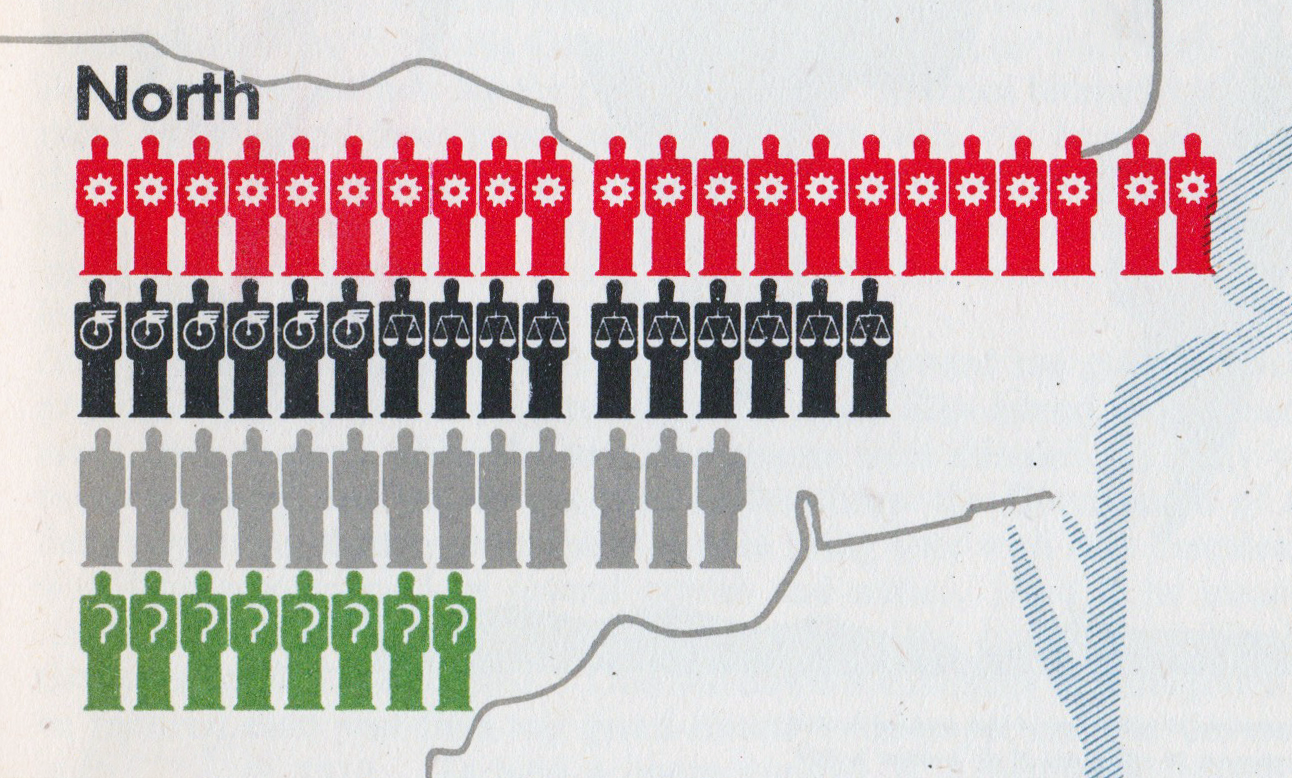
The map in “Occupations” shows a different kind of grouping mechanism than we see in this book (but we do see throughout this series). It breaks the US into three areas for comparison to Britain as a whole. By doing so it creates regions that are non-traditional but are still meaningfully comparable. For example, the Northern third of the US has more workers overall, but comparatively fewer than the South. The West has a fraction of the population from the other two, but it is distributed similarly to the North. Britain and the North share a similar make-up of occupations, probably because of British immigrants to that region.
As we have seen in other charts in this book, the grouping of the information really affects what is being communicated. By reducing this map to only three parts for the US and one for the British, it also focuses the reader’s attention. Likewise, The grouping of the icons into clusters of 10, also allows the eye to quickly sum the data as well.

The last Isotype in this book is the global map of “Coal and Oil Production”. It shows exactly how disproportionate the US, England, and Europe were to the rest of the world in fossil fuels in 1937. While the icons are approximations, it is clear to see who had it and who did not. The single barrel of oil in “Southern Asia” (current Saudi Arabia) in interesting as oil was discovered in the region in 1908 but did not take over the global demand for oil until the 70s and 80s.
Lastly, note the consistent use of icons for coal and oil across all the charts in the book. By the time this book was made, Otto and Marie were using a very consistent set of icons tested in their Vienna museum, and the color usage is consistent with earlier charts in the book as well.
The First In A Series
The charts in “Only An Ocean Between” typify the approach made by the Isotype Institute during this period. Otto and Marie took a systematic approach to craft a larger system for understanding the meta-story, broke this larger narrative into themes, then focused each chart in the series to tell a story. It is brilliant work that builds a cohesive approach to educating the public on the core concepts of the book. The next book in the series, “Our Private Lives”, continues the systematic exploration by focusing on the cultural life of the two countries.
This article comes as part of a series on Isotype and derives mainly from research on the design process created by the team at the Isotype Institute, and the life and work of Marie Neurath. My goal is to teach people about the techniques and mindset of this data-driven design team, in order to inspire new information design concepts today.
Major thanks to Alyssa Bell, RJ Andrews, Georges Hattab, Paul Kahn, and Elijah Meeks for the editing and continued support!!

Jason Forrest is a data visualization designer and writer living in New York City. He is the director of the Data Visualization Lab for McKinsey and Company. In addition to being on the board of directors of the Data Visualization Society, he is also the editor-in-chief of Nightingale: The Journal of the Data Visualization Society. He writes about the intersection of culture and information design and is currently working on a book about pictorial statistics.
- Jason Forrest

- Jason Forrest

- Jason Forrest

- Jason Forrest


