
As we continue to expand our understanding of data visualization history, we add the names of practitioners who have sought to effect change through reporting data. Let’s add the name of Monroe Nathan Work to the list in order to understand his impact on the story of data.
Monroe N. Work was an African American sociologist, scholar, and researcher who spent his life collecting information and helping others to understand it. The highlight of his career, according to Work, was the nine editions of the Negro Year Book between 1912 and 1938. Each edition was an encyclopedic collection of yearly facts and data that covered many aspects of African American life as compiled by Work from data submitted from the wider community. Each subsequent edition quickly became the essential source of Black data in the United States and was reported on widely by the White and Black press and used as a resource equally in many schools in America and abroad.
But their author, Monroe N. Work, remains far less known than his contemporaries W.E.B. Du Bois and Booker T. Washington despite collaborating directly with both leaders. After sharing research with Du Bois early in his career, Work had the opportunity to start the Department of Records and Research at the Tuskegee Normal and Industrial Institute, which was presided over by Booker T. Washington.
This positioned him at the intersection of Black leadership and education in the US for most of his life, to which Monroe Work threw himself into the task of expanding public consciousness through data. In order to drive the importance of certain datasets, the Negro Year Book went a step further by featuring a number of hand-drawn charts focusing on education, healthcare, and mortality.
Collecting data may not be the calling for the most extroverted people, and this certainly was the case with Monroe Work. He was a soft-spoken, hard-working, and tenacious collector of facts whose dedication to data provided generations of scholars with the empirical ammunition to fight for equality and justice.
Find all editions of the Negro Year Book, plus my full research documentation in this public folder.
The road to Tuskegee
Born to formerly enslaved parents, Work had a protracted education (he didn’t get to attend high school until the age of 23) which eventually brought him to enroll at the University of Chicago to become a sociologist. After graduating in 1903, Work moved to Savannah, Georgia to work at Georgia State Industrial College, which offered a small salary but gave him access to a vibrant Black community and a start for his research.
Moving to Savannah provided Work proximity to W.E.B. Du Bois in Atlanta, who welcomed him into a long-standing collaboration as a fellow Black scholar. After publishing several articles in Du Bois’s journal at Atlanta University, Du Bois personally invited Work to the initial meeting of the Niagara Movement conference in 1905 as a member of the “Committee on Crime, Rescue, and Reform” as well as the “Committee on Interstate Conditions and Needs.”
Savannah, Georgia was a charged social environment and Work flourished as a key member of Black society. He established the Savannah Men’s Sunday Club with over 300 members and featured speakers (including Du Bois, Robert E. Park, and others) sharing new ideas on education, healthcare, crime, housing, and other factors inhibiting social equity—topics known collectively at the time as the “Race Problem.” This gave Work a platform to mature professionally and share a number of important papers on health and crime, as well as his early research on African languages. Savannah was also where Work met his wife of 41 years, Florence Evelyn Hendrickson.
He quickly became professionally respected as a fastidious keeper of the facts and his activism-through-research caught the eye of Booker T. Washington, a skilled and charismatic orator, fund-raiser, and president of Tuskegee Normal and Industrial Institute (later University) in Alabama that pioneered industrial, agricultural, and higher-education for African Americans. Washington at first contacted Du Bois to start a history department at Tuskegee, but when he declined, Work was contacted to consider the post. The decision to move to Tuskegee seemed like an easy decision, here’s what Work—and his wife Florence—had to say about it:

After arriving in Alabama, Work created the “Plan for Making Tuskegee a Greater Center for Information Relating to the Negro,” which mapped out a system for expanding a library as well as a “systematic gathering of data” relating to the Black experience that encompassed both historical and current events.
After publishing his first few papers and pamphlets on behalf of his new department, Booker T. Washington suggested that Work publish a “yearbook of Negro progress” to honor the 50th anniversary of emancipation in 1913. The first edition of the Negro Year Book was published as a joint effort by Work and Tuskegee in 1912 at a hefty 225 pages. It sold for 25¢ and was mailed for 5¢ more—which is equivalent to $10 today. The first edition sold 5,000 copies quickly, which provided the necessary funds and enthusiasm to triple the page count and print run by the 1914-15 edition.

The first edition of the Negro Year Book in 1912 set the tone for the series by dividing its content into three sections: an overview of African American life (with supporting data) in 1911, an overview of Black Americans in context to the world’s Black population, and a final section documenting the story of enslavement and emancipation. More than anything, the first edition essentially converted the assorted newspaper snippets and assorted data already collected by Work and his team as a first-of-its-kind resource for collective Black memory.

By the 1914 edition, the Negro Year Book also solicited facts about African Americans as part of a campaign to collect information. This took the form of a contest for the “most practical suggestion” with a hefty prize of $50 (roughly $1,500 today). Collecting information was central to Work’s plan for his department, and by this time he had already been receiving newspaper clippings, quotes, and assorted notes from universities and researchers across the country. By turning this into a contest, Work created a real incentive for laypeople to contribute, and in essence, it helped him to crowdsource his archive.

Author Linda McMurry elaborates on his impact in her book Recorder of the Black Experience: A Biography of Monroe Nathan Work:
While the Negro Year Book was, and still is, a valuable asset to the historian and sociologist, its impact was also significant among laymen. The facts it supplied inspired blacks with confidence in their ability to progress and refuted the rumors of black decline that were widespread among whites. The prestige of Tuskegee Institute lent credence to the facts presented in the yearbooks and allowed them to be distributed through white newspapers and to be accepted in both the North and South. There are many mentions of the Negro Year Book in newspapers across the country. A periodical called The Republic even declared, “The Social, legal, financial, and educational contrasts between the American Negro in 1863 and 1913 are by the very dispassion of their telling made miraculous. The book is written for reference use, yet many successive pages read like romance.”
Work himself considered the Negro Year Book as his most significant accomplishment, saying:
The answering of inquiries about the Negro, which came to Tuskegee from all parts of the world, became an important aspect of the work of the Department of Records and Research. I kept the recipes to all questions received. On the basis of these replies there was published in 1912 the first Negro Year Book, a compilation of facts relating to the Negro. Almost immediately the Negro Year Book became a standard reference on all matters pertaining to the race. Its circulation in the course of time became world-wide.
What follows is a series of examples from various editions of the yearbooks. Every edition focused on education, an area that Work was particularly passionate about. (I’ll explore other topics of interest in forthcoming articles.)
Visualizing educational inequality
Work added a series of charts on education in the 1914-15 edition. By the next edition in 1916-17, the education chapter was elaborated to 58 pages and included the most number of charts. While W.E.B Du Bois created remarkable charts for the 1900 Paris Exposition on the same subject, Work focused on the bigger story of American education and the lack of investment in Black children.

The series of charts begin with “Per Cent Negro Children In School And Out,” which features horizontally stacked bar charts sorted by the percentage of Black children in school, with Oklahoma at the top with about 62% in school and Louisiana at the bottom with about 28%.

What is immediately evident is the humble way the chart is printed. The chart is straightforward and the design is clean despite being hand-drawn. The chart is arranged in three sections—the group at the top being above 50%, then Texas at 50%, and the rest of the states trailing below 50% (all of them Southern).
Work presented the data in this format originally in the 1914-15 edition but then reworked the design over the next 10 years. As you can see below, his first chart was hand-drawn, while the next two versions are printed as rudimentary bar charts. The last two versions include data on White students, but use tick marks to show those out of school. It’s interesting to consider how Work experimented with the design of this chart over time, yet collected the data in the same way from the beginning.

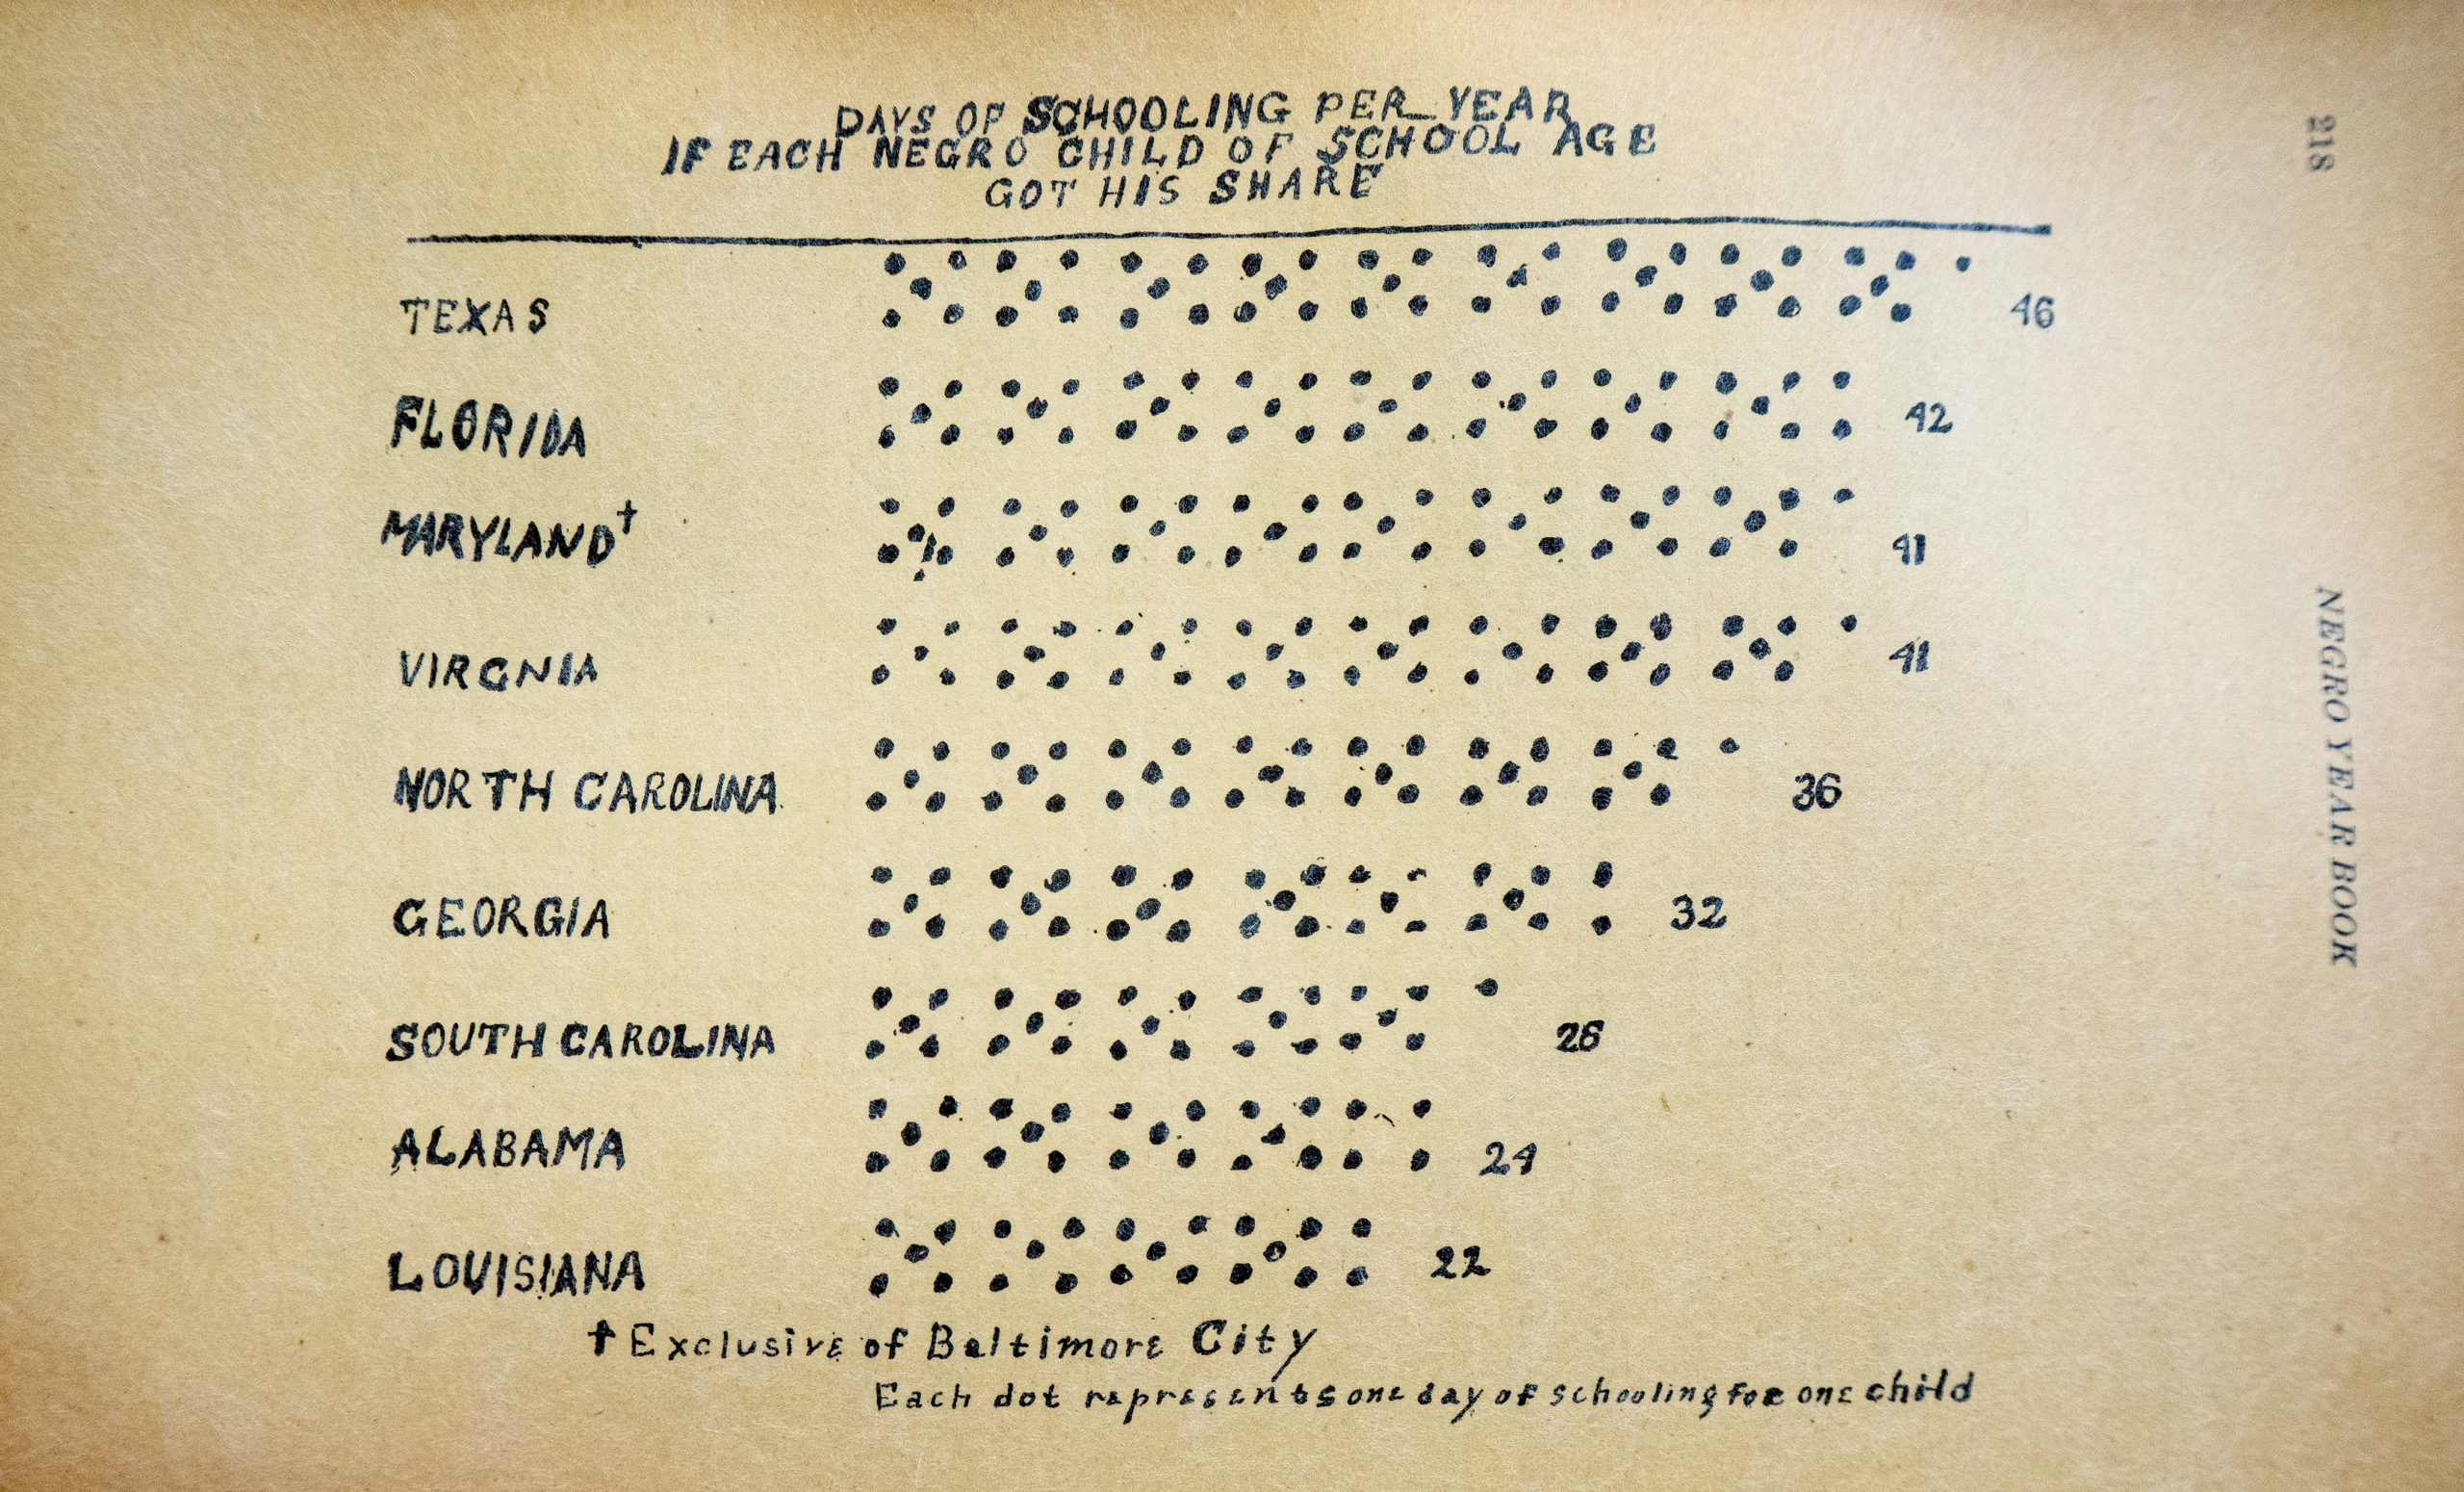
The second chart in the series is as unique as any that shape our field. In my opinion, it is equally as captivating as Florence Nightingale’s rose and as engaging as Du Bois’s spiral:

This is the 1914-15 version of the chart, and the first time it appears in the Negro Year Book. It is hand-drawn, like most of the charts from this edition, but the measured conception of the chart really packs a punch. “Days Of Schooling Per Year If Each Negro Child Of School Age Got His Share” is a unique design that connects Work’s statistical analysis directly to his argument of unequal investment in education. Each five-spotted dice pattern represents a week in school, each dot a school day.

Work divides the total number of days attended by the number of children of school age to get the per-capita average for each state. It’s a great way to show the scale of the issue in a way that creates empathy and grabs attention. (On a personal note, can you imagine every African American child in Louisiana only being in school for a month and two days per year?)
Work hid the real surprise in a data table that followed the chart. There, he showed the average number of years that it would take a child to complete an elementary course (grades 1-8). By this accounting, it would take an African American person 33 years to get an elementary school education in South Carolina.
This chart was recreated twice in the following editions. In 1916-17, the chart was typeset instead of hand-drawn:


While it’s interesting to consider how the impact of the hand-drawn versus printed charts cultivates different emotional responses, the data, itself, is equally stirring. While Louisiana and South Carolina are relatively unchanged, Maryland and North Carolina see significant improvement. Texas initially improves between the editions but then stagnates in the subsequent version.
The 1918-19 edition was the last year this chart was included, and it was oriented vertically on the page with more standardized typesetting. The story in the data is effectively the same with the overall trend in the data flattening out. Louisiana and Georgia see modest gains while South Carolina actually drops to 25 days annually, down from 26 days.
By changing the format and design of this chart, the charm is completely gone. The proximity of the dots doesn’t visually align with the idea of a five-spot dice and the numbers are lost on the page. It’s heartbreaking to see this version because it doesn’t live up to the impact of the previous versions.
It’s uncertain what exactly changed, was this a different printer? Why did the orientation become vertical? Why did they use asterisks instead of dots? Regardless, it’s an interesting exercise in design exploration. It’s clear that Monroe Work could visualize data to make an efficient and compelling argument, but access to funding and technology likely forced him to focus his efforts elsewhere.
The next chart in the series compares investment in White versus Black schools.

The chart is sorted in descending order by White investment and the bars themselves appear to be made from a kind of tape in the printing process. As you’ll see this technique is used across many of Work’s charts and I assume this is due to how the book was printed, likely using an offset lithography process—the standard at the time.

While the story in the data is clear, the chart could be made more self-evident. As I show in this chart based on the original data, if Work would have removed some of the states where investment was more equitable, then the scale of unequal investment in Black and White schools would be more obvious. But this was not his intention, as Work was interested in presenting as much data as possible to challenge popular opinion and erode misconceptions.
Work’s factual approach furthered his book’s reach significantly by making it less controversial for White publications and schools to cite. The Virginia Vicksburg Herald published a feature article calling the 1915-16 edition “helpful and inspiring almost beyond measure,” while the Denver Star called Work an “Historian who knows his business.” The Colorado Statesman even ran a front-page essay about the overall inspiration of his work concluding with thanks to Work for “this timely message to our people… for the benefit of making them firmer in the cause that concerns them and is of the greatest importance in their lives.” Because Work collected and presented the data without emotion, it gave visibility to the facts at a time when prejudice could easily have omitted them. (See here for my collection of reporting on Work and the Negro Year Book.)
Interestingly enough, the previous edition of the Negro Year Book in 1914-15 featured a novel and very different approach to this data:

I’ve mentioned the humble printing methods of the book mainly because they stand out for their ingenuity despite an obvious lack of resources. The sophistication of the story of Work’s data is nuanced and clever; its hand-made nature appeals to us as dataviz practitioners because we can see the hand behind the analysis.
This chart is essentially a unit chart of “$” signs struck many times with a typewriter to create a crude icon for “dollar.” These units are arranged in rows with the corresponding amount at the end of each row. We see the values for White and Black schools with the most per capita spent in Washington, DC. For Mississippi, we are left with only 93¢—not even enough for a single icon.
Again, we see Work experimenting with the format of the chart to make a point. One certainly wonders if Work had seen Du Bois’s Paris Exhibition charts, or if he was informed by other charts used in sociology. There are references to additional charts by Work and his department in an exhibition at the Georgia State Fair in 1908 and also in some of his earlier pamphlets. Further research is needed to help them come to light.
While the publication was expanding between the editions—from 228 pages to 488 in just three years—Work emphasized collecting more facts. Following each of Work’s charts is a table of the data. Interestingly, there isn’t a chart on this data on the number of teachers despite the inclusion in the paragraph that introduces the chapter on education. It is fascinating all the same.

In order to highlight access to education, Work focuses the next two charts and a map to explore Illiteracy:


Work shows that African American illiteracy in 1915-16 was clearly connected to age and geography. The data is stark. The depth of illiteracy in the Southern states presages the impending Northward Black Migration for better living conditions.
The next chart shows the total scale of education by attainment for African Americans. It’s a chart that Work continues to publish even after the rest of the charts fall away in later editions because I believe it shows the urgency of Black scholarship.

The remaining suite of three charts round out the yearbook’s education chapter and are included and updated from the second edition of 1913-14 through the eighth edition of 1931-32 in similar formats. All are created out of the same “tape” to create the bar charts.


In these charts, Work explains the finance of Black education. These numbers would have signified vast amounts of money at the time. Collecting and quantifying the sum total of Black education in America shows the scale of the inequity in a way that few other metrics can. While the African American population is an ethnic minority in the United States, the data proves how little had been invested at a time when the need for education would have been imperative. By compiling the total costs for all education, then breaking out the funding opportunities available, Work not only points the way for other Black educators to get access to funds (which he lists in detail at the end of the chapter) but also brings his story full circle in detailing the massive investment by African Americans directly into their community schools.
Setting the record (straight)
At the beginning of his career in sociology, at the age of 37, Monroe N. Work began to define what would be his life’s work: “If Sociology has primarily to do with human beings in their associative capabilities, then its primary function is thorough investigation and research, to collect a body of information that will point out, make clear, what these relationships are and what in the present, the now, should be done in order that these relationships may be made more harmonious, more just and proper.”
Work’s collaborator and friend Jessie P. Guzman noted in writing his obituary:

Work biographer Linda McMurry writes, “The principle driving force in Work’s life was neither accommodation nor protest, rather it was an abiding faith in the ‘impact of fact’. His main concern was to obtain the best possible outlet for the fruits of his research.” A few chapters later, she adds, “With his faith in the impact of fact and his uncharismatic demeanor, Work’s quiet, scholarly presentations were in keeping not only with Tuskegee’s program but also with his own personality… Indeed, throughout his almost 40 years at Tuskegee, Monroe Work was a quiet but insistent voice for change in the institute’s approach to both education and race relations.”
Through a steadfast belief in facts, Monroe N. Work not only established the structure for how data on African Americans was collected, but he also invested his life in presenting it to the world at large. There is much in Work’s life to share; in a follow-up to this story, I’ll present a body of charts that he created to effect dramatic improvements in African American health conditions.
Special thanks
Monroe Work first came to my attention by Dr. David H Jackson Jr., Provost of North Carolina Central University. It was his guidance to explore the Negro Year Book which has continued my exploration into Black scholarship. I believe that data visualization may have played a significant role for many activists and scholars throughout the beginning of the twentieth century, the civil rights movement among them.
Thanks very much to Emily Barone for editing!
You can find every image from this article as well as all editions of the Negro Year Book here in this public Google folder containing all my research materials:
While Monroe Work is a remembered figure in African American history, his life has not received much documentation. There is only one book about his life and work, Recorder of the Black Experience: A Biography of Monroe Nathan Work by Linda O. McMurry from 1985. Her care and deep empathy for Work’s life does his legacy a great service.
Prior to McMurry’s biography, an accounting of Work’s life was compiled in 1949 as an in-depth obituary by Jessie P. Guzman, who collaborated with Work from 1938-44 when she took over for him after his retirement at the Tuskegee Institute Department of Records and Research. She went on to compile and edit two subsequent volumes of the Negro Year Book in 1947 and 1952.
There is also a lengthy article, “You Can’t Argue with Facts: Monroe Nathan Work as Information Officer, Editor, and Bibliographer,” by Mark Tucker published in 1991. While he focuses on an enormous bibliography that Work assembled later in his career, it is a great summation of his work and contains additional research and scholarship.
Additional links
Monroe Work portrait in National portrait gallery: https://npg.si.edu/object/npg_S_NPG.67.28
Site created highlighting Work’s documentation of Lynching: https://plaintalkhistory.com/monroeandflorencework/
Tuskegee archives: http://archive.tuskegee.edu/repository/digital-collection/the-negro-yearbook/

Jason Forrest is a data visualization designer and writer living in New York City. He is the director of the Data Visualization Lab for McKinsey and Company. In addition to being on the board of directors of the Data Visualization Society, he is also the editor-in-chief of Nightingale: The Journal of the Data Visualization Society. He writes about the intersection of culture and information design and is currently working on a book about pictorial statistics.
- Jason Forresthttps://nightingaledvs.com/author/editor-in-chief/

- Jason Forresthttps://nightingaledvs.com/author/editor-in-chief/

- Jason Forresthttps://nightingaledvs.com/author/editor-in-chief/

- Jason Forresthttps://nightingaledvs.com/author/editor-in-chief/


