
According to the Oxford Dictionary, friendship is a “voluntary, personal relationship characterized by mutual affection, trust, and support.” Whereas to me, friendship involves authenticity and a trustworthy partnership that involves fun, kindness, and understanding.
It’s the size of the smile on your face when you see someone. It’s the decision to stay in touch with a niece long after family events end. It’s the fragile silence between you and a friend who couldn’t support a recent life choice.
As a data designer, I’ve always been obsessed with how we categorise the intangible. Recently, I set out to map the people who have shaped me. I didn’t want a balance sheet, but I did want to see the patterns. A relationship always evolves; this would only represent a snapshot in time.
The Taxonomy of Connection
I began by listing every person I care about. First from memory, then verified by my friends list on Facebook. But as I opened my spreadsheet, the questions started to flood in. Can family members count as friends? For example, my nieces and I have been chatting nonstop for years now. We grew fond of each other through the circumstance of birth, but we stayed in touch by choice. Does that make them friends? And what about friends who aren’t supportive of my life choices? We were very close 7-8 months ago, but we are not now. Are we still friends? If I exclude her from this, does that mean I have given up on our friendship? Also, I use the term “friend” very loosely. I am naturally familiar with strangers. Is my new neighbour — with whom I have shared a few cups of tea — my friend?
To make sense of the friend list, I distilled friendship into three core metrics, scored on a scale of one to three, three being the highest rank possible:
- Reliability: Loyalty, faithfulness, and the feeling of being safe.
- Empathy: Supportiveness, kindness, and open communication.
- Joy: Playfulness, liveliness, and shared common ground (though one might question whether friendship is required for common ground; for the sake of this visualisation, I decided it was).
I also added two judgment values: Duration (how long we have been friends), and Contact (how recently we spoke). To keep the data honest, I limited the scope to friends I had contact with in the last 24 months. I chose 24 months as a mark because it’s the period since my daughter was born. Spoiler alert: In a time when I often felt lonely as a new mother, the data showed me I was actually deeply loved.
From Sketching to Scripting
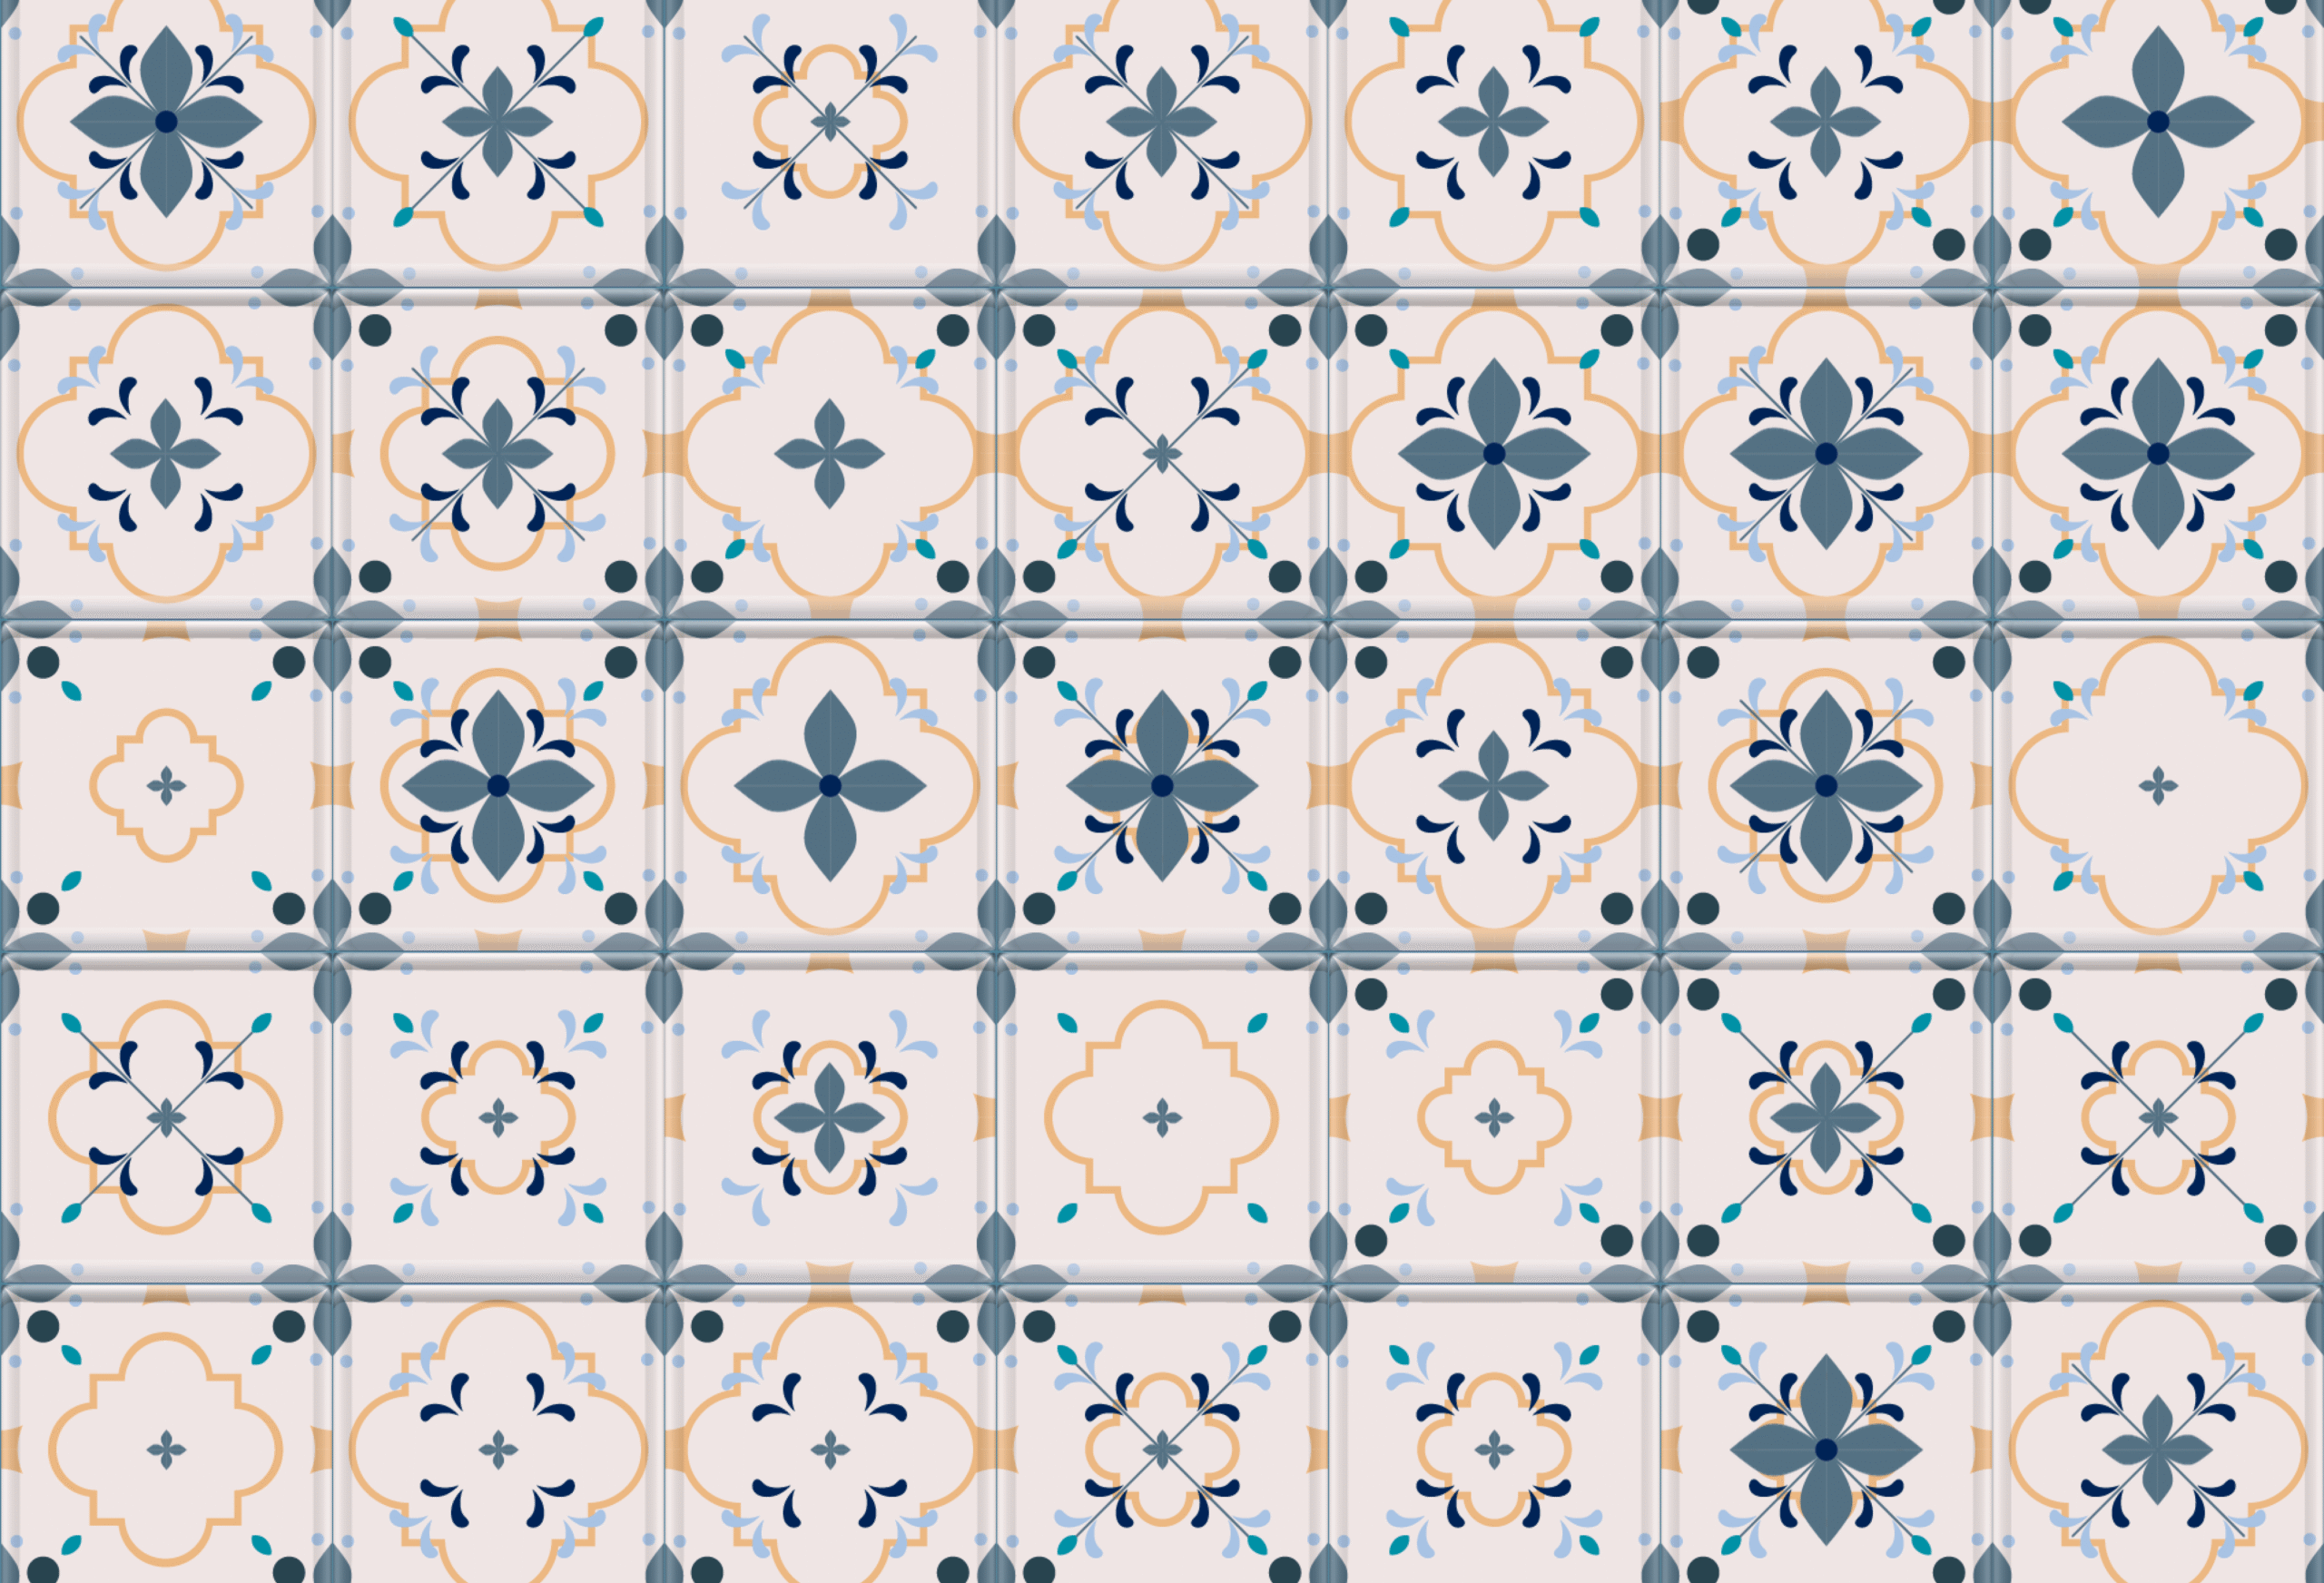
In my notebook, the design evolved rather quickly into a series of “tiles.” I remember having the visual in my head for a while, and I felt as if I were a vessel letting it out onto the paper. I wanted something that would represent the scale’s levels easily. Level one was a simple base; level three added complex detail.

Initially, I used background colors to denote duration, but the palette was too loud. It made the story about “how good I am at making friends” rather than “how these friendships built me.”

Then came the pivot. Usually, I build these visualizations by clicking the mouse. A thorough process of copying, pasting, and double-checking layers in Illustrator and Figma would easily take three hours. But, inspired by the “vision to execution with a click” movement, I turned to Claude and Gemini.
I asked Gemini to help me write the prompt for Claude. It generated a Python script that processed my Excel file and generated stacked layers as PNG files. Claude taught me how to install Python on my Mac. (Honestly, I felt like I was back in the 90s, typing into a terminal to launch a game.) Then, “Boom. Your tiles are ready.” With a single click, the assets were generated. A few back-and-forths with Claude, and the grid was aligned. The work was done.

The Cost of Efficiency
As I looked at the finished folder, a strange feeling washed over me: I didn’t recognize the data. By automating the execution, I had accidentally bypassed the data familiarization stage — that meditative hour where you handle each data point with care and remember the person behind it. The tiles were beautiful, but they felt distant.
It raised a fundamental question for our field:
If the AI builds the layers, are we co-creators? Or are we just curators of our own memories?


The Tokens of Gratitude
Despite the digital distance, the final grid is a testament to my life. These tiles are me. They represent the people who stayed through puberty, the ones who signed my wedding book, and the new friendship that started when I collected my son from preschool, which grew close.
This project is more than a visualization; it’s a token of gratitude. It captures a snapshot of my soul as it exists in 2026. Shaped by humans, rendered by machines, and held together by the voluntary, personal relationships that make life worth mapping.

Or is a critical thinker and an enthusiastic data-visualisation designer who finds patterns in everyday life and transforms them into clear, meaningful visual stories. She previously lead the UX & Data Visualisation within the Business Intelligence department at IEC. She just started a practice-based PhD exploring how data visualisation can support more balanced decision-making for people living with diabetes.
- Or Misgav

- Or Misgav

- Or Misgav

- Or Misgav


