
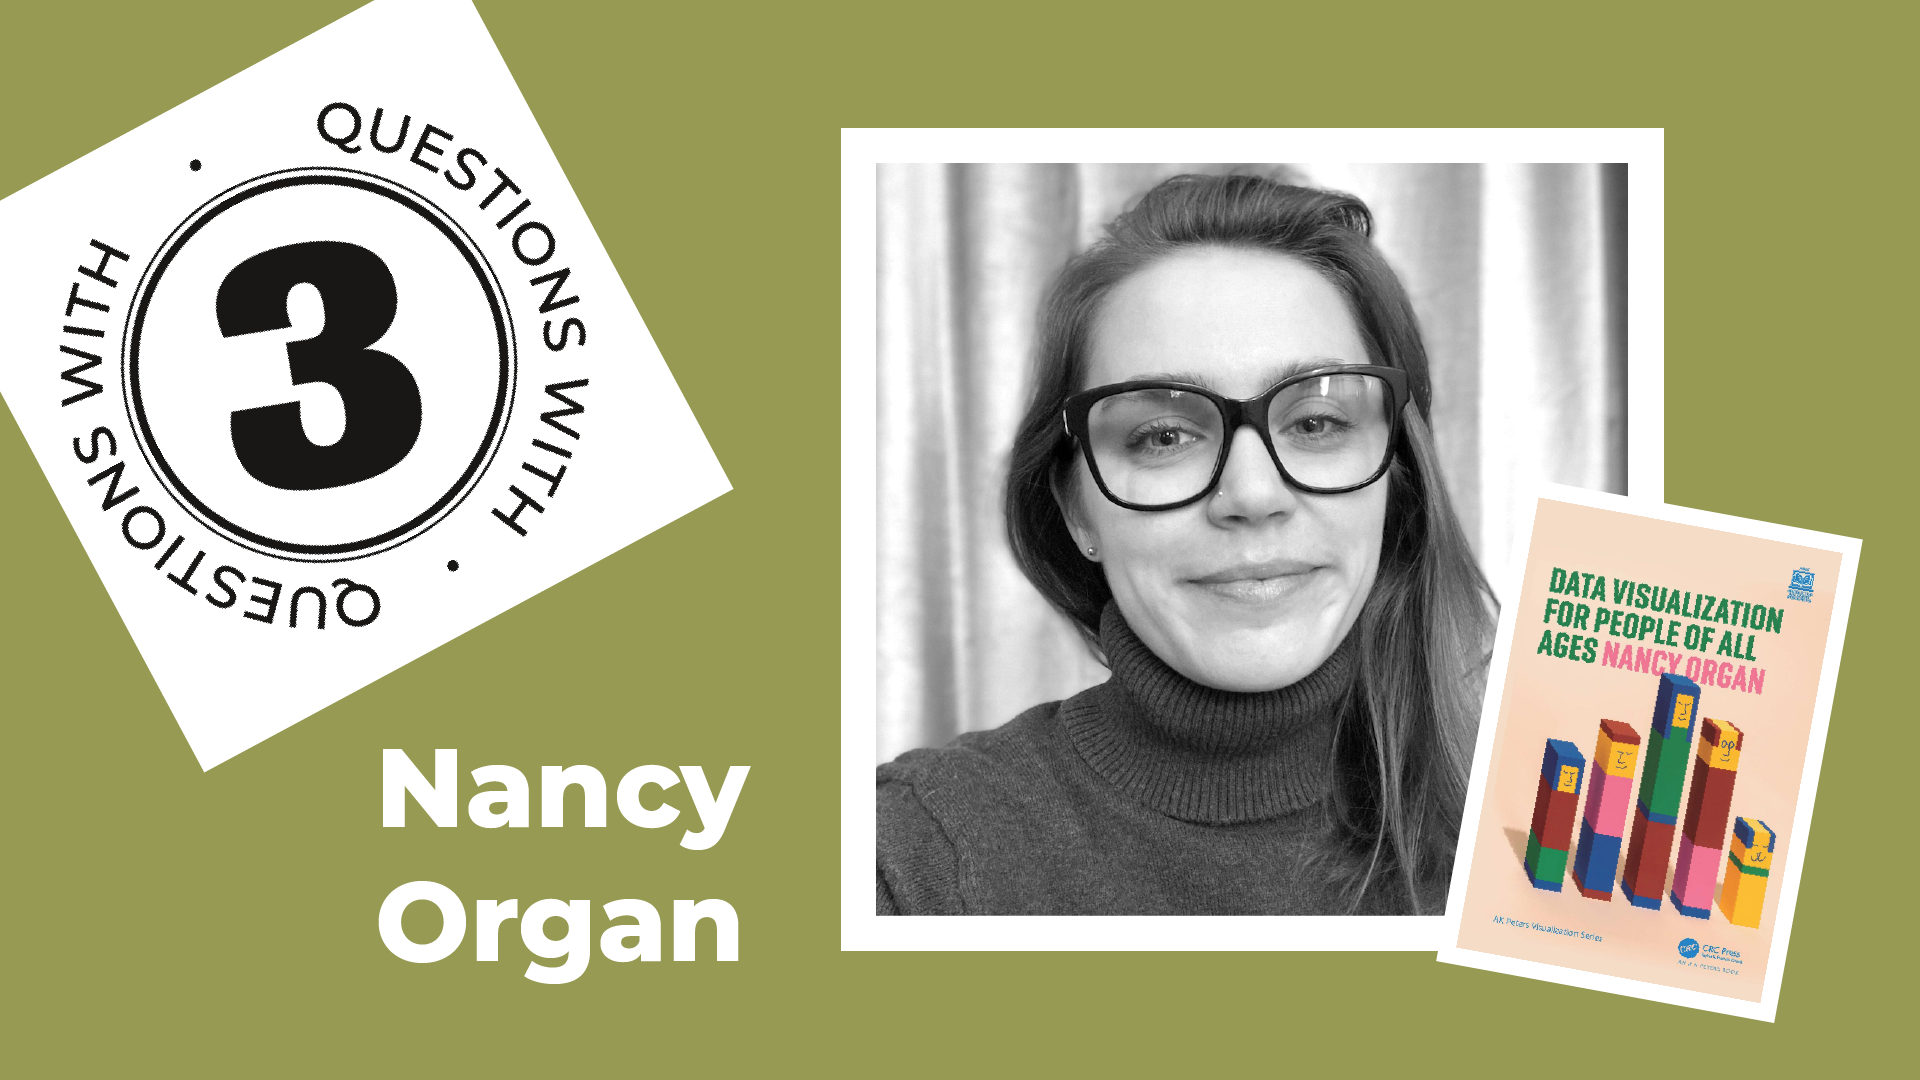
on her new book, Data Visualization for People of All Ages
Nancy Organ is a Seattle-based data visualization practitioner and author of Data Visualization for People of All Ages. An emphatic response to the gap in visual literacy education for people young and old, the book uses lighthearted examples to illustrate graduate level theory so that everyone can learn what it really means to visualize data. Her background is in research, education, and tech, including contributions at Microsoft and the University of Washington. She is currently the Data Visualization Lead at Trilliant Health, a growth stage startup working to make the health economy more efficient and performant for providers and patients alike.
1. If the book went to a dinner party, what kind of guest would it be?
It would absolutely wear polka dots and show up 5 minutes early! I think my book would love going to a dinner party, because data vis is all about sharing the stories and information that we care about with the people that we care about. It would probably sit in between the chatty grown-ups and the tween who didn’t really want to be there, and end up having super interesting conversations with them all. And if a mashed potato sculpture contest began? It would definitely have a shot at—dinner pun intended—taking home the cake!
More seriously, the title of the book is very literal: it’s truly meant to feel fun, inviting, and useful for people of all ages. I wrote it to the ten year old version of myself—the curious fifth grader who really disliked being underestimated—as well as to the wonderfully smart people I work with now that I’m a quarter century older. In all honesty I think it could be passed around the table at a dinner party just as happily as it could sit on a bookshelf in a corner office, or on a desk in an elementary school. Some things are so essentially human that they transcend age, and data visualization is one of them.
2. It’s the 47th consecutive day of rain in Seattle and Data Visualization for People of All Ages is the only book in the house. Which chapter should I read?
There are so many possibilities and it totally depends on the situation! If you’re really starting from scratch, I say start from the beginning and see how far you get—that’s how it was intended to be read. Each chapter builds on the last, so you might miss some lightbulb moments if you skip ahead. That said, let your interests be your guide, and jump to whatever looks interesting! The chapter “Visualization Whoopsies” is a good one if you’re feeling a little philosophical. Or, there’s one on color blindness that is exceedingly practical.
If you’re hanging out with your family or roommates, try “Chapter 14: Sound and Touch.” It explores data sonification and physicalization, and the activities at the end are designed to be interactive. Even for an experienced data visualization enthusiast, changing the medium to something audible or tactile can be a real treat.
3. What does the voicemail greeting of your book say?
It says, “If you’re calling to report a word cloud, Sankey diagram, or tree map, please hang up and get yourself a bowl of ice cream—they’re just like that. If you’re calling about missing data, please contact the relevant authorities. If you’re concerned about unaesthetic outliers, weird colors in a gradient, or inaccessibility? Me too. For all other inquiries, please re-read Chapter 15 or leave a message after the beep!”
Nightingale Editors
Our Nightingale editorial team currently consists of Alejandra Arevalo, Brian Cort, and Teo Popescu. Reach us at Nightingale(at)Datavisualizationsociety.org
- Nightingale Editors

- Nightingale Editors

- Nightingale Editors

- Nightingale Editors


