
Ever wonder what’s happening behind the scenes at DVS? What are the Board and Committees working on? What’s coming up soon?
Here’s a bit about what we’ve been up to, and what is coming up in the next month or two.
New membership options
In June, we announced new membership levels and the new members-only portal on datavisualizationsociety.org. Catch up on all the details on our launch post in Nightingale!
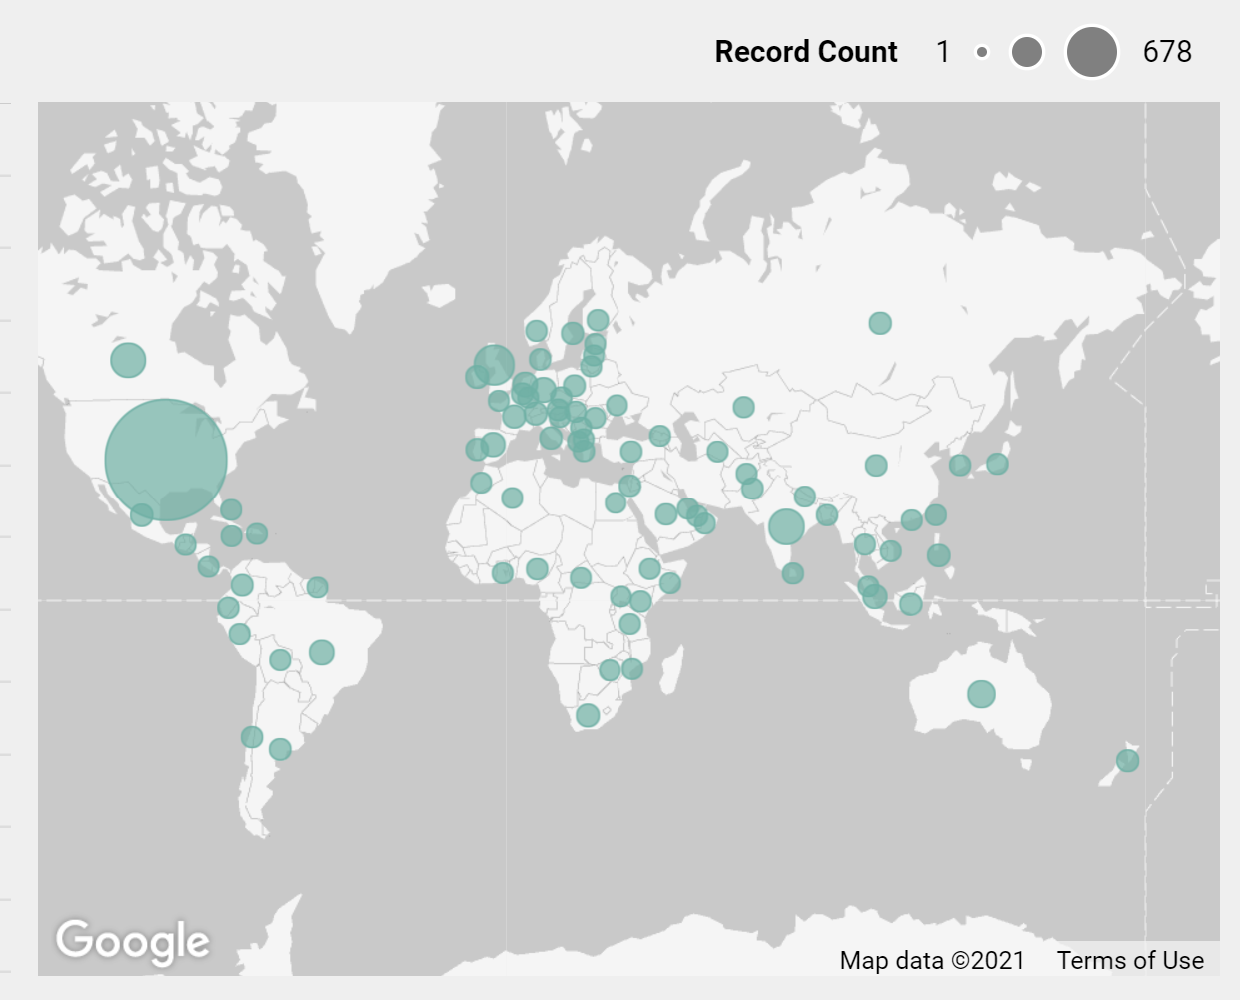
In these first two months since launching the portal, we’ve had nearly 1,500 members register from countries around the world. Approximately 28 percent of these members opted into one of the paid member tiers (thank you!) while the remainder registered at our free tier.
We’d love to see more of our existing members signing up on the website and creating a profile – you’ll need to join again either as a free or paid member to do so. It’s the best way to get the most of your DVS membership via access to more resources, communications, and even member discounts accessible to paid members at any level!
Getting started on Outlier 2022
Nearly 1,000 people joined our first ever global conference in February – and we’re excited to share that we’ve started planning for Outlier 2022! Save the date for February 4-5, 2022 and watch for details about potential speakers and sponsors to come. If you missed Outlier this year, you can check out all of the mainstage talks on the DVS YouTube channel.
Fireside Chat: Accessibility
Fireside Chats started in 2020 as a way to bring together experts on dedicated topics, facilitated live to enable members to ask their questions of the panelists. In July, we hosted our second chat on Accessibility in Data Visualization.
I loved the focus on the opportunity for a mindset shift about accessibility in data visualization. Amy Cesal shared her event highlights on Nightingale.
As for the future of accessibility in data visualization, the panel agreed that better browser support is essential, but so too is a perspective shift among designers: thinking about accessibility can lead to visualizations that are more fun and interactive!
Data visualization designers often approach accessibility from the perspective of compliance, which can mean dread and negativity, but accessibility is, in reality, an extension of what we are already trying to do, what we already think is fun to do—finding creative ways to communicate data through experiences.
Highlights from the DVS Fireside Chat on Accessibility in Dataviz
Watch your inbox for announcements of upcoming chats on Hiring in Data Visualization, Clinical Dataviz in Health Care, and Dashboards. If you have a recommendation for a topic or panelist, fill out the short form on the Fireside Chats landing page on our website.
What’s in progress for DVS?
There has been a lot of heavy lifting behind the scenes during the first two quarters of 2021. We wrapped up Outlier in February, migrated Nightingale from Medium to our own website, built our members-only portal on our website, launched paid membership tiers, and we are working on some of our organizational infrastructure.
Through the end of the year, we’re developing more programs for you to connect with the community and build your dataviz skills, including:
- Launching the 2021 State of the Industry Survey (formerly known as the Data Visualization Census) this month, led by the Programs team. You can read all about the survey and how the data is used here on Nightingale, or just go right to the survey!
- Kicking off a new approach to onboarding members with our Cohorts initiative, where new members can connect with a small group of others who join the same month and learn more about how to get involved, led by the Communications team.
- Setting up our initial geographic chapters and topical interest groups, led by our members and supported by DVS. We’ve started by connecting with moderators from some of our active topics channels on Slack. You can email Membership Director Nena Untung at membership@datavisualizationsociety.org if you are interested in learning more about leading a group.
- Building out a series of dataviz job profiles, with general responsibilities and required skill sets, to provide more visibility into career paths and opportunities to work in data visualization full time, led by the Education team.
- Laying the foundation to better support early career members, including profiling early career members to amplify their work, organizing monthly Finding Your Path conversations (this month we are having a discussion about building your career in data journalism on August 18), and planning monthly meetups for the early career community
Last, and deserving of more than a bullet point: while our annual general meeting and elections for open board seats won’t happen until December 2021, we’re already working on the nominations process.
Board terms span two years and are staggered such that part of the board turns over each year. The roles with terms ending this year–that are open to new candidates–include: Education, Publications, Partnerships, and Events. If you’re interested in learning more about the nomination process and the open roles, please fill out this DVS Nominations Interest form or watch your inbox for more details next quarter.
As always, if you have any questions, please reach out to me on Slack or email me at executive@datavisualizationsociety.org. I love connecting with our members and can always direct you to the right Board member if you have an idea or suggestion for our team.

Amanda Makulec is a health data visualization designer, teachers, and speaker based in Washington D.C. who volunteers as the Executive Director for the Data Visualization Society. She holds a Masters of Public Health from the Boston University School of Public Health, and worked in more than a dozen countries leading teams and developing user-centered data visualization products for federal, non-profit, and private sector clients.
- Amanda Makulec

- Amanda Makulec

- Amanda Makulec

- Amanda Makulec


