
Our experience of time is simplest described like this: we move forward, and we measure periods by units like seconds, minutes, hours, etc. But I don’t really think that’s all time is to us.
Time is also very not simple. As an experience, not all hours or minutes feel like they are the same length. And when we reminisce about the past or flash to an imagined future, it’s like we are transporting ourselves to a different moment. To me, in some way, our brains experience that time again.
I do not mean to say that I do not live in a world where I gauge time linearly; I do prepare an hour ahead of time to get ready to catch a bus to work and I do set my lights to turn on when it gets dark outside. What I want to do here is to look at these meanings – the simple and not simple – simultaneously.
That’s where I ended up in this project, exploring this question of a variable time in a human experience. This is about an audio mashup, and I hope that the data visualization itself is bound to the experience of a variable time.
Overview
This project explores our experience listening to an audio mashup. Mashups bring material together from different sources, and in this example, intended for an audience familiar with the source material. How do we process the pieces of this material brought together in a new form?
A listener may relate to the source material emotionally, socially, or structurally, so I think there are many interesting ways to look at this question. This project’s direction goes specifically into structural references, not because I think that is most important but because it was the thought I wanted to pursue.
I choose to look at this question for this mashup by the time position of the tracks. What is our experience of time when we have experienced the source material in time previously? Could I quantify samples by time placement, and what would that show? The direction of this visualization is focused on the global position of the samples, or where they are in relation to the entire song. However, it would also be interesting to focus more locally, on where the samples are relative to a phrase or song section.
Method
In this exercise, I looked at “The United State of Pop 2008,” a mashup by DJ Earworm that samples the top 25 songs in the United States in 2008. The source material is chosen by popularity in a region, so familiarity with the sourced songs is probably intended for the millions of people who streamed the songs.
I collected data on placement to connect the use of the sample in the mashup to the sample from the original song. This was based on my ordered experience of listening to song tracks repeatedly, and then later to the mashup.
Song tracks are set to play for a period of time. The track begins, plays, and ends; this process can repeat in exactly the same order. I ‘could’ have formed some kind of memory of these songs over the course of the year, because I listened to the radio in the United States and heard the chart-topping songs many times. With this theory, I wanted to quantify then visualize how a mashup draws on existing experiences to create a new experience from references. Specifically based on ordered, time references from the original song tracks.
Data Collection
First I notated the segments of the mashup to gather each sample’s information, e.g., the song source, lyrics, and stop/start points. Then for each song source, I noted the number of samples and the order they were used in the mashup. I added this info into an Excel document manually. I used ELAN to store precise start and stop times, which so far has been used as a reference and not programatically.

I then reviewed where the samples appeared in the original song. This wasn’t always a one-to-one match. For example, if a sample appeared in a chorus, it would repeat again (all of these songs have choruses, a pop song section). I therefore had some choices in how I collected the data. How would I discern where a sample appeared in the source song? I decided that order was important, because the experience of time is, as I understand, unstoppably moving forward, so I decided to look for the samples in the source song in the same order that they appeared in the mashup.

I would not go backwards, which could result in not finding a sample, running out of bounds, or going ‘overtime’.

I wanted to transform start times across the songs, because a sample appearance at 0:25 would mean something different depending on the length of the song (which typically ranged from 3-4 minutes).
Using a proportion appeared to be a solution, though it would be more precise than I wanted. As a percentage, values would range from 1-100. Rounding and grouping could be done, but I was not confident that the meaning would make sense across songs.
Instead, I looked at the songs’ other indicators of points of time. The songs consisted of similar sections, a journey familiar to pop music listeners.
These pop songs flow through a pattern of pop song sections. They feature song sections like verses and choruses. There can be more nuanced sections like pre-chorus, post-chorus, and a refrain. I tracked intros, verses, choruses, bridges, and outros. I did not track, for example, a pre-chorus; I grouped it in another section if I heard it.


Data Visualization
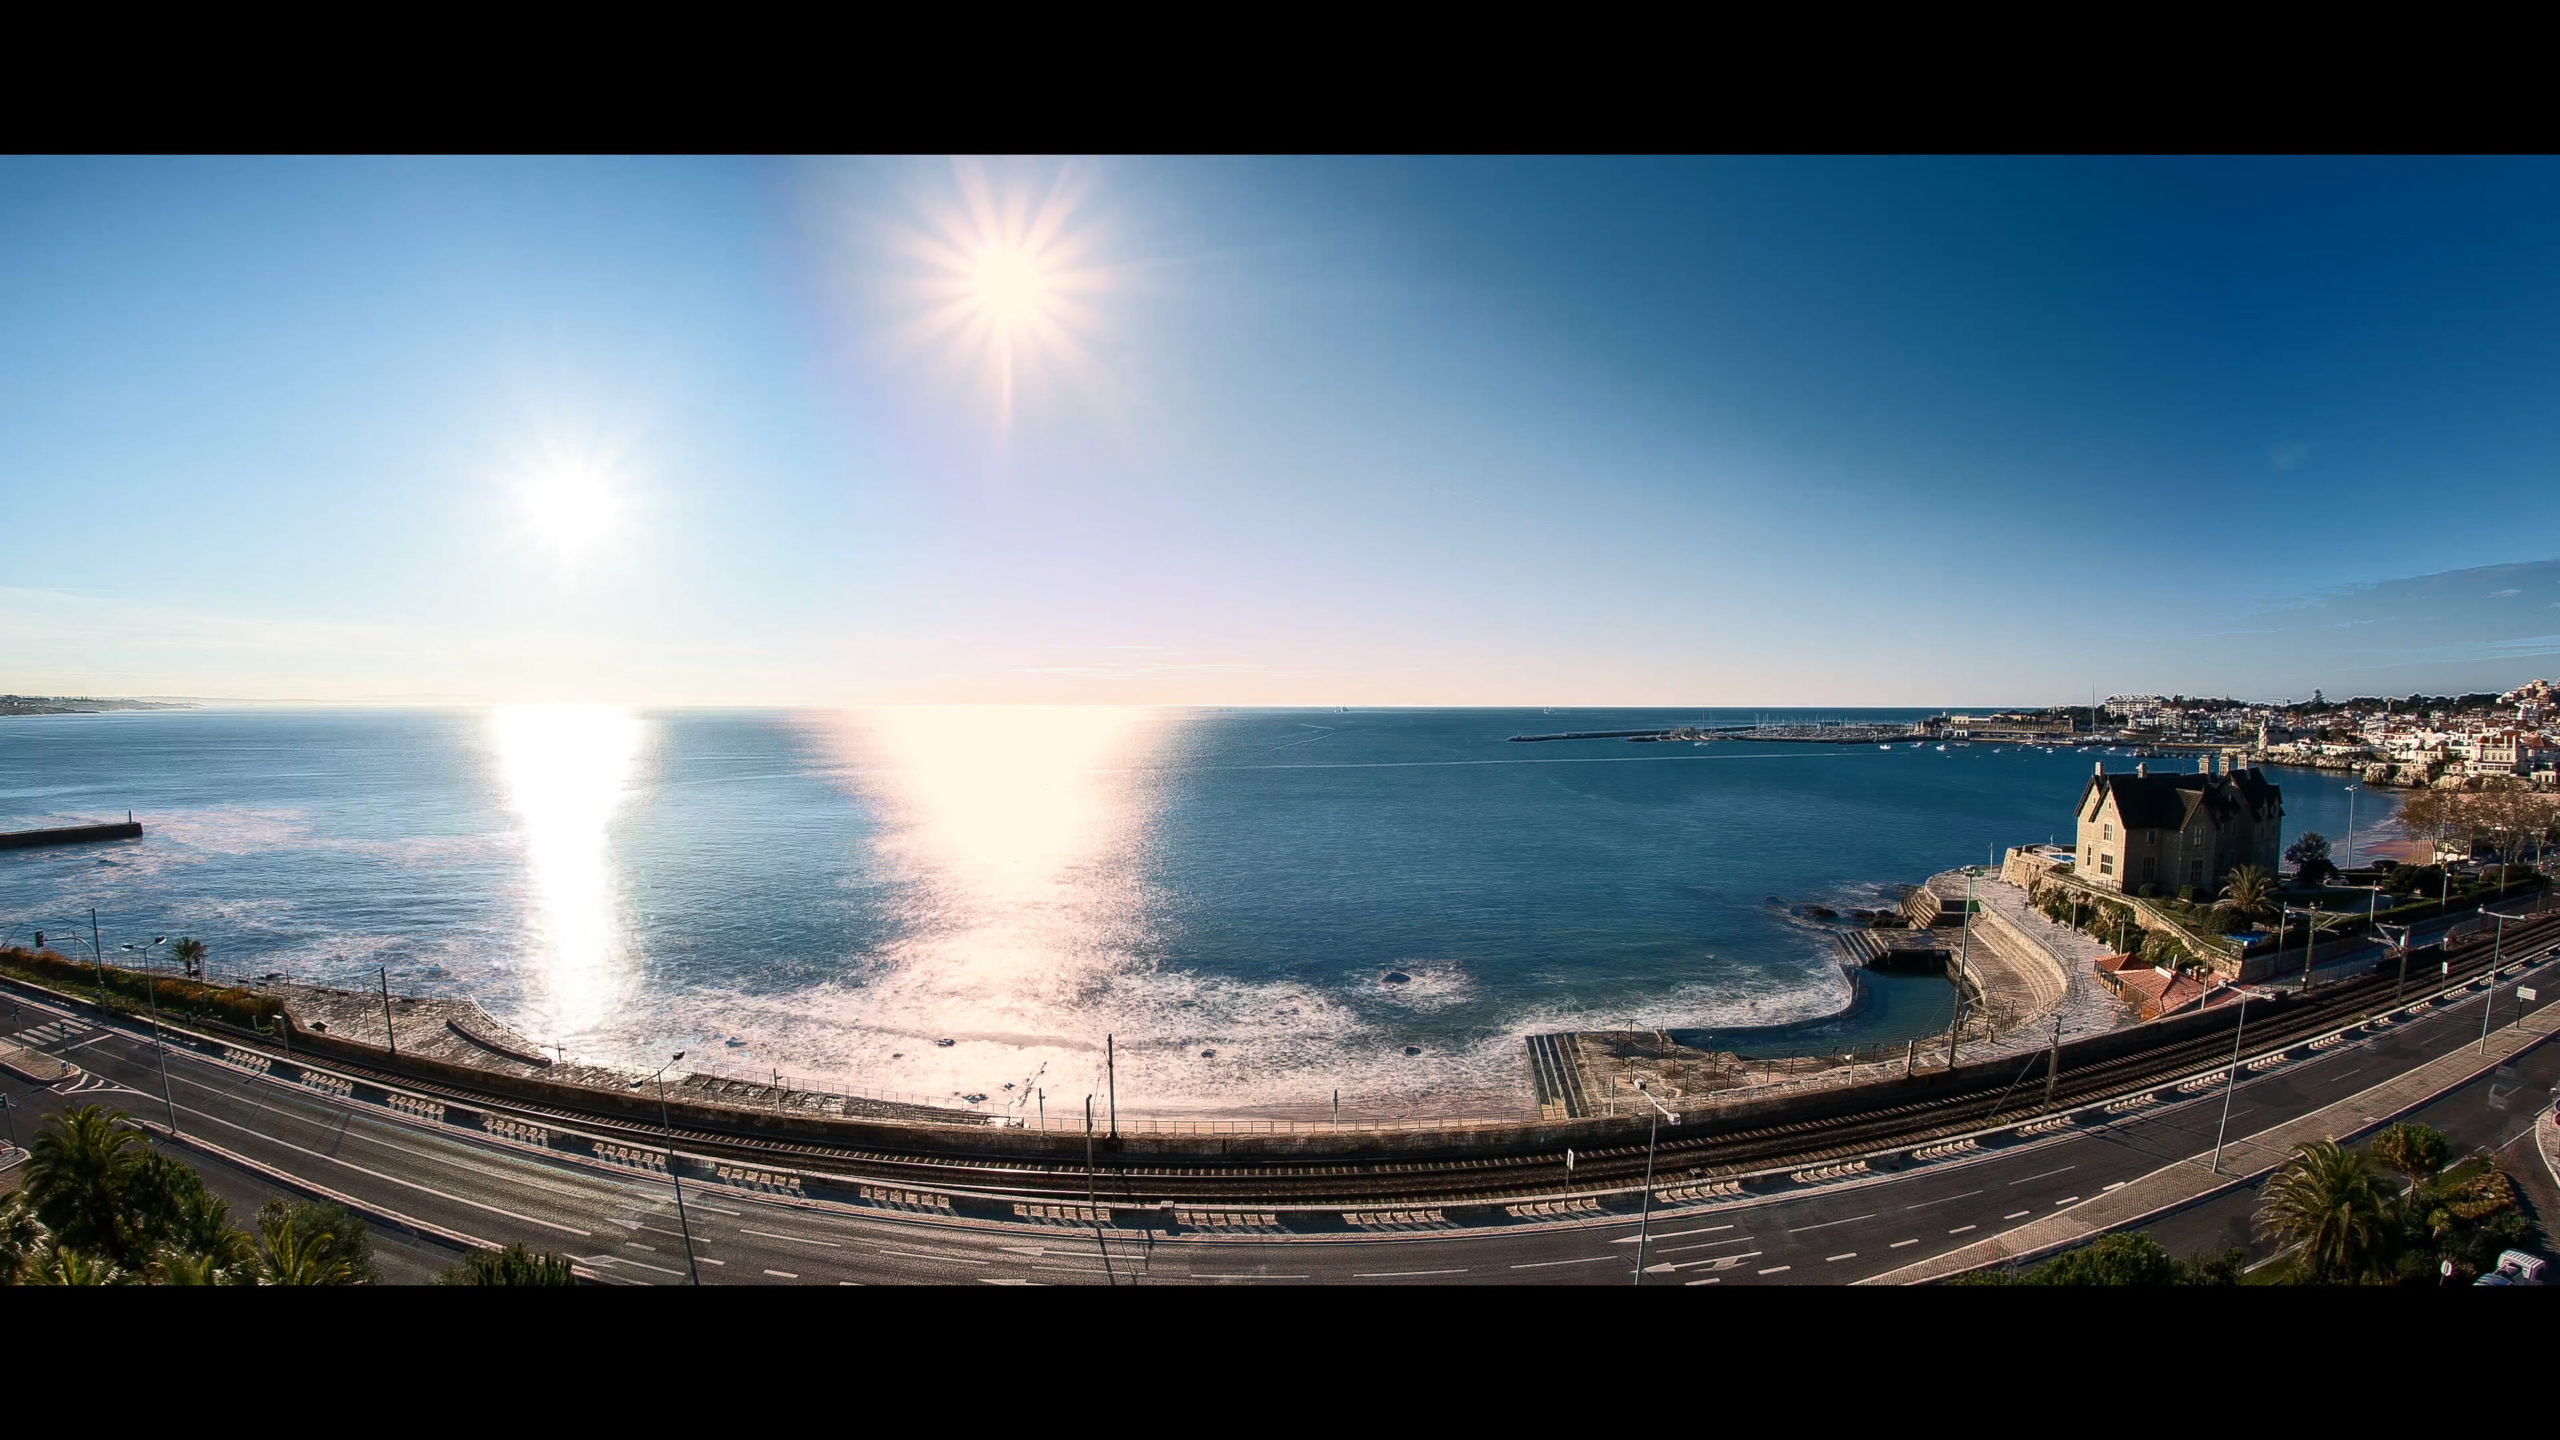
The next part of this project transitioned to data visualization. This data vis syncs the data to a visual of the sun at different points of the day. I thought it was a good unconscious relationship to a relative point in time—the beginning, middle, or end of a cycle.
Essentially, the position of the sun is “the time of day” of the sample in the source song. This is a rough translation, because the transformed data uses only 7 sun positions.
Pictured below, are the seven sections of the day used in the visual, left to right, 1 to 7. There are two sun colors. The first (more blue/white sun color) is used for instrumental samples, and the second (more orange sun color) is used for vocal samples.


With this framework, this data visualization becomes a video. The sun visuals are synced to the mashup audio. It is named ‘Woven Time’, likening the composer’s role to sewing time together.
Below is an excerpt of the video without audio.
Visual Representations for Sample Songs
On this webpage, the video is linked to information about the sample songs. Each song has a visual representation of the data, for example the picture below.

Click here to see the interactive page:
On the interactive page, the information about a song is synced to show up when it appears in the video. The song detail is synced to measure number, a music term for chunks of time. The timing of the sun in the video will be more precise than the entry of the song visual.
The final video visualization can also be viewed here, without supporting synced info.
Thoughts
I am so interested to know what people think of this interpretation. If you feel like you want to share thoughts, please send them to me!
Caitlin is a data engineer, with a focus on BI, business intelligence, solutions. She is a curious interdisciplinary learner. With a M.A. in Music Theory and Cognition, she enjoys combining her skills to be creative and thoughtful.
- Caitlin Cowen


