
Alt text (sometimes called alt tags or alternative text) are written descriptions added to images that convey the meaning of the visual. Good alt text helps more people understand the content. Assistive technology like screen readers reads the alt text out loud so users can hear and understand the visual content. People who use screen readers often have a vision impairment. This includes people who are totally blind, but also people with low or impaired vision.
Not writing alt text means that people miss out on content that is necessary, just because it’s visual. It means it’s not accessible.
Alt Text defined from Webaim:
It is read by screen readers in place of images allowing the content and function of the image to be accessible to those with visual or certain cognitive disabilities.
It is displayed in place of the image in browsers if the image file is not loaded or when the user has chosen not to view images.
It provides a semantic meaning and description to images which can be read by search engines or be used to later determine the content of the image from page context alone.
There are many resources for how to write alt text generally (I list more at the end of this piece), but few that provide guidance for how to write descriptions for data viz.
How to write for alt text for data visualization
So how do you write something short that conveys the whole meaning of a visualization? You probably can’t. That doesn’t mean that you shouldn’t try.
- Adding alt text is better than not doing anything at all if there’s meaningful information in the image.
- Add a long description if you can add HTML, to more fully convey the meaning.
- Supplement with a link to the raw data, so curious readers can access the data in their own preferred program.
- Keep your alt text short. Alt text is read linearly by screen readers, which means that people can’t go back a word if they missed something. For SEO purposes, Google cuts off after a certain amount of characters.
The World Wide Web Consortium (W3C), an international Web standards setting community, offers guidelines for alt text for complex images, but it can be difficult to interpret how to apply these to data visualization. Below, I interpret these guidelines to apply to charts and graphs. Refer to the W3C guidelines for nuance and compliance.
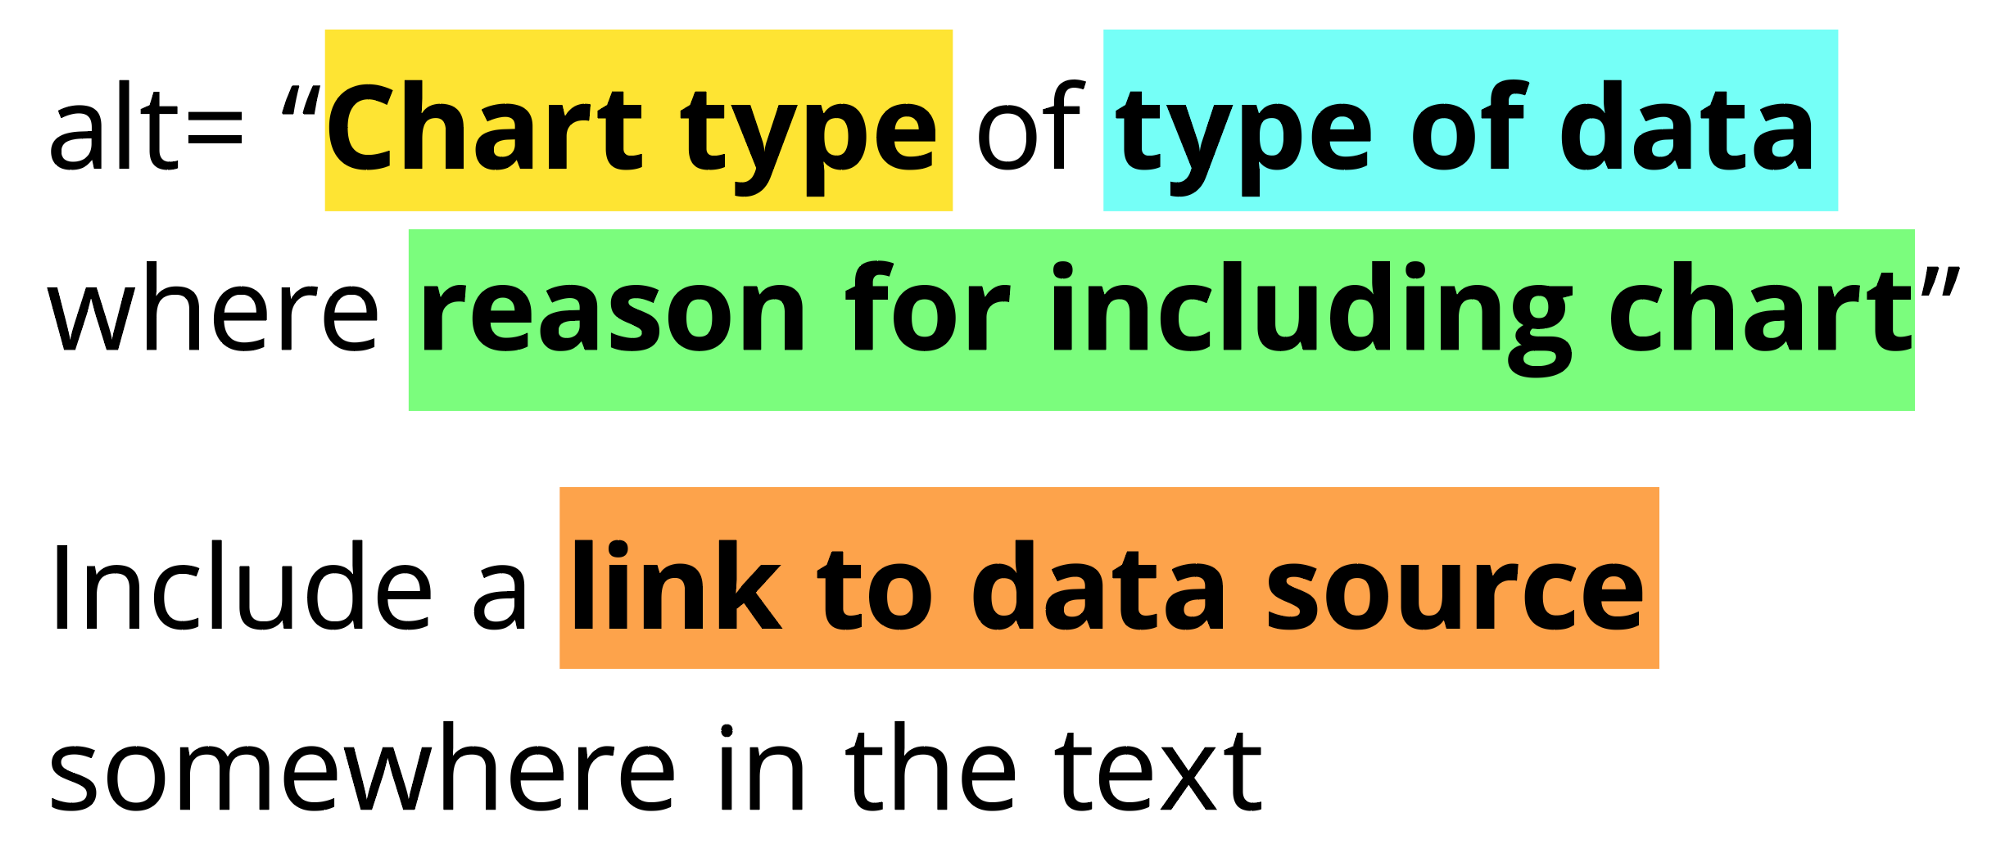
Here’s a simple formula for writing alt text for data visualization:

Chart type
It’s helpful for people with partial sight to know what chart type it is and gives context for understanding the rest of the visual.
Example: Line graph
Type of data
What data is included in the chart? The x and y axis labels may help you figure this out.
Example: number of bananas sold per day in the last year
Reason for including the chart
Think about why you’re including this visual. What does it show that’s meaningful. There should be a point to every visual and you should tell people what to look for.
Example: the winter months have more banana sales
Link to data or source
Don’t include this in your alt text, but it should be included somewhere in the surrounding text. People should be able to click on a link to view the source data or dig further into the visual. This provides transparency about your source and lets people explore the data.
Example: Data from the USDA
Simple chart alt text example

If I was posting this chart from the New York Times article “How to Reduce Shootings” on social media I would include a link to the article and write this alt text:

Complex chart alt text example

If I was posting a less typical chart type like the Warming Stripes from Ed Hawkins, I would include a link to the source and focus on the meaning behind them for the alt text:

How to add alt text
In HTML code
Add alt text alt="" to any image that adds meaning inside the image tag <img>. Add a long description longdesc="" when possible.
On Twitter
When you add an image, use the add description button or +alt. Twitter has full instructions.


On Instagram
Instagram hides the alt text functionality, but there is documentation on how to add alt text.
- Choose a filter and edit the image, then tap Next.
- Tap Advanced Settings at the bottom of the screen.
- Tap Write Alt Text.
In Microsoft Office products
Microsoft Office has a variety of ways that you can add alt text depending on which program and what version you are using. However, they have extensive documentation on how to add alt text.
On Medium
Click on the image in the post. Use the “Alt text” label to write your text.

By writing effective alternative text or alt text and including it when you publish data visualization you provide a way for people who cannot see the image to understand the content so they are not missing out on critical information. Having alt text is necessary in order for the visual content to be accessible.
Other reading
Alt text
- Web Accessibility Tutorials: Complex images| W3C
- Alt Text & Accessibility | Web Aim
- How to Write Great Image Alt Text | Catherine McNally
- The Right Way to Write Alt Text | Natalie Gotko
Accessibility for dataviz
- Data Visualization Accessibility: Where Are We Now, and What’s Next? | Melanie Mazanec
- Why Accessibility Is at the Heart of Data Visualization | Doug Schepers
- An intro to designing accessible data visualizations | Sarah L. Fossheim
- 5 easy ways to make your data visualization more accessible | Amy Cesal
Thank you to Doug Schepers and Zander Furnas for reviewing.

Amy Cesal is a data visualization designer and instructor. She is a co-founder and board member of the Data Visualization Society. Amy is a 3 time Information is Beautiful award winner and enjoys creating unusual data visualizations. She holds a Master's Degree in Information Visualization from the Maryland Institute College of Art, where she is an adjunct professor. Amy has pioneered the use of data visualizations style guidelines, and writes and speaks on the topic.
- Amy Cesal

- Amy Cesal

- Amy Cesal

- Amy Cesal


