
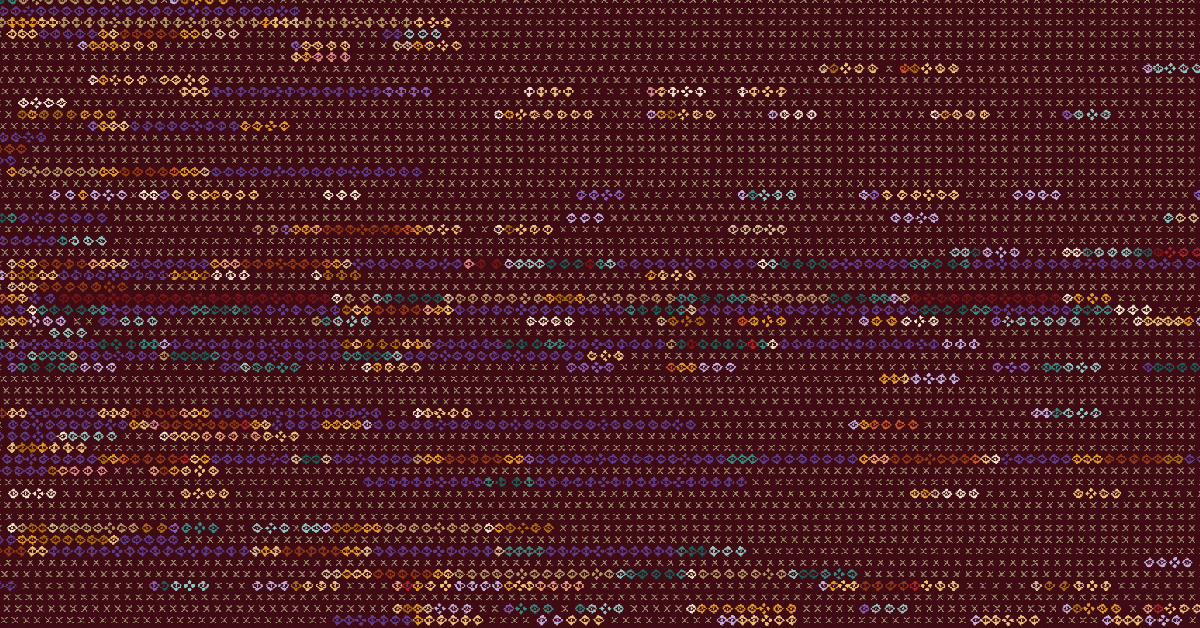
We often overlook what is most visible not because it requires no attention, but because familiarity blinds us to what is right in front of us. This project introduces the term “Plain Sight Effect” to describe the way familiar people, places, and routines gradually disappear from our attention despite remaining constantly visible.
Distributed field work remains systematically understudied because data about it either doesn’t exist or exists inside platforms that have no reason to share it. For example, gig-economy delivery riders and drivers are among the most intensively tracked workers in history, yet the telemetry data is almost inaccessible as it belongs to the platforms. Institutional field workers—railway ticket-checking staff, postal carriers, and the like—fare no better: No platform tracks them, so their work is barely discernible. One workforce is watched, its data unshared; the other is not watched at all. The public understands neither.
The ticket-checking workforce is Indian Railways’ most geographically distributed and mobile workforce. It is broadly divided into two groups: the Squads, who conduct surprise inspections for ticketless and irregular travellers at stations and on trains, and the Amenities staff, who travel with passenger trains, assisting passengers during boarding, deboarding, and throughout the journey.
The entire network of Indian Railways is organised into 18 zones, which are further divided into administrative units called divisions. Hyderabad Division is one such division in the South Central Railway zone; it is named after the city of Hyderabad, where its headquarters is located.
Kacheguda is the home station and the administrative base for the ticket-checking staff of Hyderabad Division. The division’s Squads are stationed at five bases across the division: Kacheguda, Mahbubnagar, Kamareddi, Kurnool, and Nizamabad. The Amenities staff sign on at Kacheguda, board their assigned trains, and work outward along one of the division’s railway corridors: north through Nizamabad Junction towards Nanded and on to Adilabad; south-west through Mahbubnagar and Kurnool towards Guntakal Junction; or south-east towards Cuddapah (Kadapa) Junction, at times continuing south through Dharmavaram to Yesvantpur in Bengaluru, nearly 500 km from home.

At the end of a duty, a member of the Amenities staff may rest for a few hours, sometimes overnight, before working a return train back to Kacheguda. This simple rhythm of depart, rest, return, repeated by 116 Amenities staff, together with the surprise-check movements of 30 Squad members, generated 42,840 GPS pings over 20 days.
This project documents and visualises the work of the Hyderabad Division’s ticket-checking staff over 20 days, from 00:00:51 on May 24 to 23:57:47 on June 12, 2026, using a purpose-built Android tracker app that pinged each participant’s GPS location every 10 minutes. Participation was voluntary.

Source: Author’s analysis of GPS tracker data from Hyderabad Division ticket-checking staff. Visualisation by the author.
Why a saree?
Data rendered in textile is not a new genre, but the traffic in that tradition has run mostly one way: Western data into Western craft forms such as knitting, cross-stitch, and quilting. I have not found Indian textile forms widely used for data encoding.
A saree is a traditional garment, generally five to eight metres long, that women across the subcontinent drape around the body and pair with a blouse. It has structurally distinct zones—body, borders, pallu, and fringe—each with its own functional and visual logic. The central field is the body, scattered with motifs and enclosed on either side by borders that run along its length. At the end of the body is the pallu, a distinct panel where the designs become more elaborate and intricate, accentuating the grandeur of the saree. It ends in the fringe, the unwoven warp ends that extend beyond the fabric.

Looked at closely, the dataset’s structure—individual movement, a collective enforcement rhythm, a derived statistic for each person, and a residue of leftover data—naturally mirrored the anatomy of a saree. The body, borders, pallu, and fringe offered distinct spaces for these different kinds of data. The saree, therefore, is not a forced imposition on the data; rather, its structure provides a remarkably natural way of visualising it.
Why ikat?
There are many techniques for weaving a saree, each producing its own visual language. Ikat is a traditional textile technique in which the yarn is resist-dyed before weaving. Bundles of yarn are tied with dye-resistant wrapping at calculated intervals, dipped in dye, retied, and redipped. Ikat offers a particularly compelling visual language for data encoding and a direct analogy for data visualisation.
Correlograms and other matrix diagrams organise information into discrete marks arranged in rows and columns, where larger patterns emerge through repetition, clustering, and alignment. From a distance, a matrix reveals shapes similar to ikat motifs. Ikat works in much the same way: The pattern is encoded into the yarn before the cloth exists, by tying and dyeing at calculated positions, and the motifs emerge only when the weaver brings those threads into alignment on the loom.
Pochampally, a town roughly an hour from Hyderabad, the capital of Telangana, is one of India’s best-known centres of ikat weaving. Pochampally Ikat received Geographical Indication (GI) protection for its signature motifs in 2005, one of the earliest Indian handlooms to do so. The motifs, called butta in Telugu, have edges that feather and bleed because the pattern is assembled from separately dyed yarns rather than printed onto completed cloth.
For a data visualisation project rooted in the movement of a railway workforce based in Hyderabad, a Pochampally ikat saree is not only a technically fitting form but also a geographically and culturally sound choice.
Ikat saree as data canvas
The data is visualised through the traditional anatomy of a saree: the body, borders, pallu, and fringe.Each part of the saree becomes a different visual layer, assigned to a specific aspect of the workforce’s movement data. The motifs—their position, colour, scale, and repetition—are determined by the underlying data rather than added as decoration. No physical saree exists yet; the design is conceptual and digital, though it could be woven as a real textile.
The Pochampally ikat grammar governs only what the motifs look like. No motif carries more than one meaning, and no meaning is carried by more than one motif. Nothing visible is merely decorative; even the gold lines serve to separate one dataset from the next. Data determines the position, extent, colour, and count of the motifs.

The motif names used below—eye, floret, X, triangle, and star—are this project’s working vocabulary. The Squads were the first to join the campaign: The first Squad ping landed 51 seconds after midnight on day one, while the Amenities warps recorded no pings for three days, until the morning of May 27. Hence, the borders’ motifs begin appearing before the motifs in the body do.
Body of the saree: presence, absence, and movement of the Amenities staff
The body is traditionally the most motif-intensive part of a saree, while here it becomes the most data-dense part of the visualisation. The 30,539 GPS pings from 116 Amenities staff are represented as 116 conceptual warp threads, with each corresponding to one person and extending across the full length of the saree.
Time is encoded along the length of the saree: The 20-day period is divided into three-hour intervals, creating 160 consecutive slots that run from the left edge to the pallu. Thus, each person’s GPS record is divided into consecutive three-hour slots. A run is a continuous sequence of such slots, represented by motifs, during which the person’s recorded location remains within roughly 25 km of the run’s centre. Once the person’s location moves beyond that threshold, the run closes and a new run begins.
Consecutive motifs chain together into one run for as long as the person’s position stays within about 25 km of the run’s centre. The moment a new ping lands beyond that, the run closes and a new one opens. So each thread is one person’s complete timeline, readable left to right. Three motifs distributed over the body represent three states—seen, resting, or unseen—of the same person over the 20-day period. Reading a thread is watching one person move between these three states.
Six dye families indicate where a run occurs, one for each place: ivory for Kacheguda, the home station; violet for the Hyderabad city area beyond Kacheguda, such as the suburbs of Malkajgiri and Cherlapalli; teal for the northern corridor (Kamareddi, Nizamabad, Nanded, Adilabad); yellow for the south-western corridor (Mahbubnagar, Kurnool, Dhone, Guntakal); rust for the deep south (Dharmavaram, Kadapa, and Yesvantpur in Bengaluru); and red for elsewhere. Further, each colour comes in three shades: pale, full, and deep. Each motif takes the shade of its location signal, and the denser the pings, the deeper the dye is.
Each run is mapped to the railway corridor in which it occurs, giving it the corresponding dye. Each motif takes the corridor’s colour, while the depth of the colour reflects the amount of GPS data recorded during the run: Fewer pings produce a paler shade, and a denser concentration of pings produces a deeper one. In this way, colour indicates where the movement occurred, while colour intensity indicates how strongly the data records it.
Say a person works at Kacheguda all afternoon. Their location barely moves, so it is one long run, rendered as a single chain of ivory motifs. Now consider a person riding south from Kacheguda to Kurnool. After every 25 to 50 km of travel, the run’s coherence breaks. So the journey renders as a sequence of runs, each a motif chain dyed by whichever corridor that stretch is nearest. On the saree, the journey is a procession of motif chains taking the colour of the corridor.

The eye motif: observed presence or active spell
- The eye motif is one of the signature Pochampally motifs, and on this saree, it carries a sense of watching. A GPS ping is literally a sighting; each 10-minute signal records a person at a particular place and time.
- Every credible Amenities ping, at any speed, appears in the body as an eye motif, except during the midnight window if the person is nearly still.
- The motif perfectly mirrors the role of the Amenities staff on board—vigilance: keeping an eye on who boards, who has not, who deboards, and who may need assistance along the journey. Each eye on the cloth therefore signifies two things: the system observing the worker and the worker keeping watch over the passengers. The workforce whose job is to see is itself seen.
The floret motif: rest or stationary night run
- The floret motif is a four-lobed flower. Each floret marks a night on which a person stayed within about 3 km through the midnight window (00:00 to 04:00), indicating an overnight stay and most probably rest. Flowers mark where people slept: a night bloom.
- The flower motif is deliberately chosen as a symbol of rest and stillness, contrasting with the movement represented by the eye. While the eyes trace journeys, the florets mark the places where those journeys pause, the moments of rest. On the saree, the motif blooms only at night, stays closed during motion, and never opens by day: A daytime rest, however long, gets no flower.
- That is precisely the habit of the region’s night bloomer, the parijatham (Nyctanthes arbor-tristis), known as night jasmine because its fragrant white flowers open at night and fall by morning. According to Hindu mythology, the parijatham is a celestial tree brought to earth from heaven by Lord Krishna, and its divine fragrance is said to be cherished by the gods.
The X motif: no observation or missing data
- The X is the universal mark for “nothing here,” so it indicates missing data. X motifs have a uniform colour, inspired by the silk yarn’s default state before any process touched it: neither resist-protected nor dyed.
- The X motif doesn’t explain why data is missing. It could mean that a device was switched off, network connectivity failed, a duty pattern changed, participation was interrupted, or something else entirely. It therefore represents absence of observation, not absence of the person.
The borders: strike of the Squads
The borders run along either side of a saree, accentuating and defining the beauty of the body. In the visualisation here, they serve a similar framing role, carrying the activity of the six ticket-checking squads.
The gopuram (triangle) motif, the most conventional element of a South Indian saree border, is adopted in this visualisation. A gopuram is an ornate entrance tower of Hindu temples in the Dravidian architecture of South India.
Here, instead of representing individual people, the motif represents collective checking activity. Whenever at least one member of a squad produces a GPS observation during a three-hour slot, that slot receives a gopuram (triangle) motif. In all, 9,824 GPS pings from the 30 staff across the six checking squads appear in the borders. The motifs stop at the pallu column, because that is where time stops.
The three bands above the body—two teal and one tan—correspond to the northern squads by latitude: Kacheguda Squad 1, Kamareddi, and Nizamabad. The three bands below—one tan and two gold—correspond to the southern squads: Kacheguda Squad 2, Mahbubnagar, and Kurnool. The two Kacheguda bands share the same tan colour and are the innermost, above and below the body, so that the same station’s two squads can be compared across the cloth.
The pallu: journey on foot
The pallu is the most visually distinctive part of a saree. Each warp thread continues out of the body into the pallu. While the body carries the main field of motifs and the borders frame it on either side, the pallu stands in complete contrast. It has its own vocabulary, often using larger and more elaborate motifs. The current visualisation takes this structural distinction as a design cue. The pallu here is used to represent an entirely different dimension: the Amenities staff’s movement on foot.
Ashtalakshmi refers to the eight special forms of the Hindu goddess Lakshmi, who represents wealth, good fortune, and prosperity. The Ashtalakshmi motif (Star of Lakshmi) is a sacred geometric motif in Indian textiles. Drawing on both its eightfold symbolism and characteristic four-directional symmetrical composition, the motif is abstracted into a form that retains its broader visual language within the constraints of the ikat resist process.
The 116 Amenities staff members’ journeys on foot are represented by gold and ivory stars alternating in a checkerboard rhythm. Fine vertical gold lines separate the columns, with each column representing a fixed distance. Each star in a row represents four kilometres walked by that person over the 20-day period, with rail travel excluded. Thus, the pallu is self-measuring: A reader can count any person’s walking distance off the cloth. Four kilometres; four points and four dots of the motif together eight stations in all, the “ashta (eight)” of Ashtalakshmi motif cannot be unseen.
The pallu therefore isolates a different kind of mobility. Rail travel accounts for most of the distance these workers cover, but walking represents the physical movement that happens because of the work itself, such as traversing platforms and moving through stations. The figure is deliberately conservative rather than a total: Only walking-speed GPS hops were counted, and faster on-train pings were excluded.
The fringe: what never became cloth
When a saree is woven, the warp threads extend beyond the woven fabric at the end of the pallu, remaining unwoven and forming the fringe. Taking this design cue, the visualisation reserves the fringe for data that did not enter the main cloth.
This dataset contains 2,477 GPS pings from two test devices, along with 17 duplicate transmissions in which the same person was recorded twice at the same timestamp. Rather than forcing these records into the main visualisation, the project places them outside the cloth as fringe. Each loose thread represents 40 discarded pings, for 62 threads in all.
In this visualisation, the fringe is in effect the test bench: the yarn that never became cloth, represented as loose, undyed warp ends.
Reading the saree, thread by thread


The scale of the job is the journey
The Amenities staff alone covered 120,113 km, while the six checking squads added a further 20,803 km of their own in 20 days. These are conservative figures, as straight-line GPS hops between 10-minute pings underestimate true paths. Every comparison below is therefore conservative, and the Squads’ movement is not included.
- Three times around the Earth: Earth’s equatorial circumference is 40,075 km; the Amenities workforce’s 20-day total equals three circumnavigations not approximately, but to the second decimal.
- Nearly three times to the Moon and back: The division’s Amenities staff travel roughly 2.19 million kilometres a year, equivalent to three round trips to the Moon.
- Nearly twice the Indian Railways network: The division’s Amenities workforce out-travels the roughly 69,000 route kilometres of Indian Railways every three weeks.
- On their own feet: The Amenities staff walked 830 km in 20 days, while Hyderabad Division spans 782 route kilometres.
Bringing the familiar into focus
The data does not uncover an unknown geography or a temporal pattern. The routes have been mapped for decades, the trains have been running for years, and the staff have been travelling them every day.
Perhaps invisibility is not the absence of sight, but the absence of attention. Their presence was always obvious, yet we were oblivious to the extraordinary distances travelled, their cumulative magnitude, and the persistence that sustained it. The obvious becomes invisible when it is seen every day, because familiarity dulls curiosity. That is the Plain Sight Effect.
Ikat, after all, has its own relationship with the Plain Sight Effect. The motifs are dyed into every thread, so they are present all along, hidden in plain sight, even before the cloth exists. Only when a skilful weaver brings the threads into alignment does the cloth reveal the pattern.
Thus, the project digitally visualises the 42,840 GPS pings recorded over 20 days as 146 ticket-checking staff went about their work. Their journeys are rendered as a composition akin to a handwoven ikat saree on a traditional loom. As in ikat, the data already contains the story; visualising it as a saree draws attention to the scale of the journeys.
Attention returns when the familiar is made unfamiliar; seeing the unfamiliar brings curiosity back. And with that, what had become mundane feels worth noticing again. The reality is unchanged; only the realisation has changed.

Anirudh Pamar
Dr. Anirudh Pamar. Z is a doctor and lawyer turned civil servant with the Government of India. A data visualisation enthusiast, fascinated by the stories hidden in everyday public systems. His work explores the intersection of public infrastructure, geography and traditional Indian craft.


