
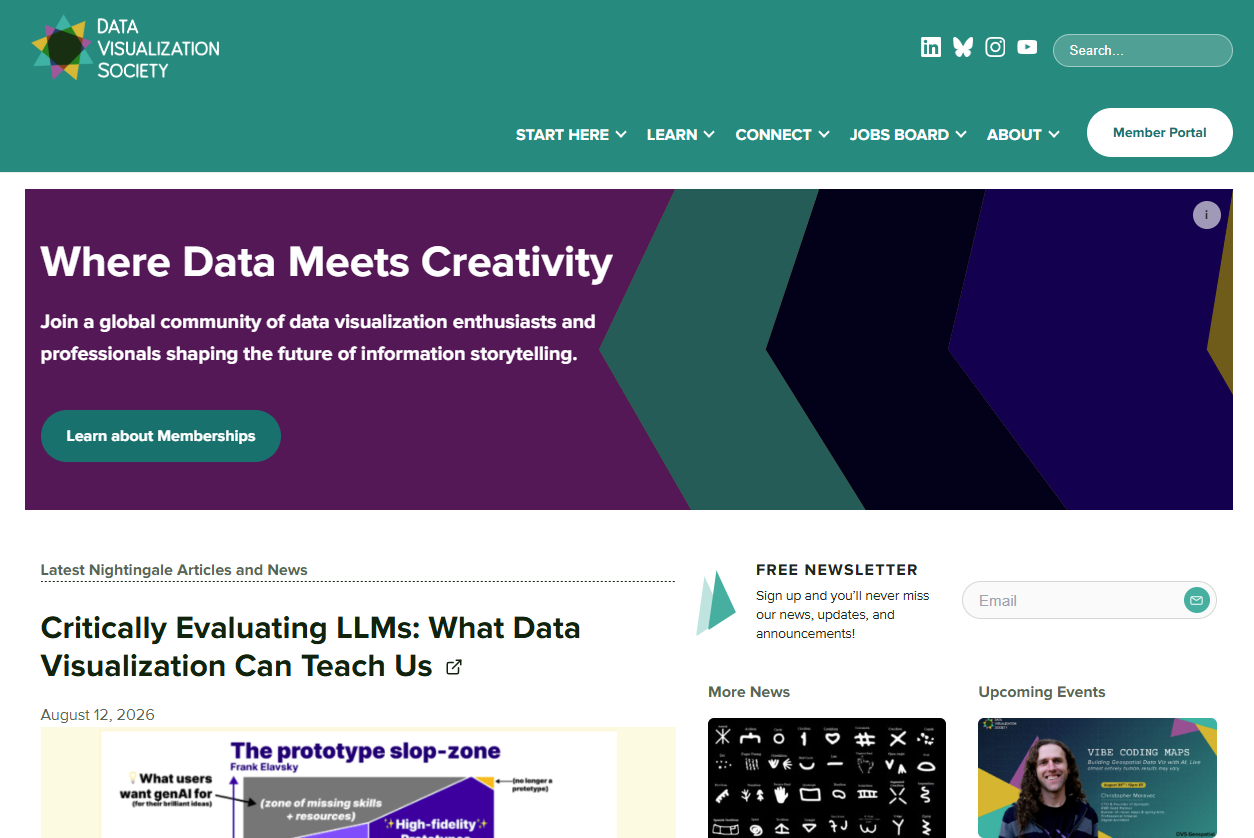
You may have noticed that the DVS website has a new look. We recently redesigned it with improved navigation and resources for data viz professionals and enthusiasts at every stage, from beginners to seasoned experts.
After DVS was founded in 2019, our library of content quickly outgrew the site’s structure and platform. Managing the volume of articles, talks, reports, and resources became a challenge for our team, while finding them became equally difficult for our members. To address this, we completely reorganized our content so members could easily find the resources they needed.
Completing a project of this scale over two years was no small feat for our mostly volunteer team. As someone who started as communications manager and later took over project management, I witnessed the dedication behind this redesign. It truly took a village, and I want to celebrate the team’s work while sharing our insights on user research, information architecture, and content curation.
Before jumping into wireframes and visual design, we needed a solid foundation, so we started with user research to clarify who our audience is and what they need most from DVS.
We wondered: “Why do people join DVS?”
When DVS was founded in 2019, I remember reading a tweet inviting people to join its email list and feeling excited to be part of this community. Back then, I was working as a data designer at a market research firm and was deeply interested in data viz. DVS felt like a chance to connect with others just like me—people who would nerd out about color choices or build accessibility in from the start. When we studied our members’ goals for joining DVS, it was validating to see that my story wasn’t unique. So many members joined for that exact same reason: to find a community where they could belong and grow their craft.
We didn’t have a big budget for research, so we used data readily available to us: Slack introductions. The DVS Slack has over 20,000 members, and we regularly see posts on the introductions channel. Broadly speaking, members joined DVS for the following reasons:
- Learn: To gain a better understanding of data viz and develop skills in design and coding.
“My current plan for now is to improve my fluency with d3.js.”
“… want to gain a deeper understanding of data science and viz.”
- Connect: To meet like-minded people and expand their network.
“I am excited to connect with this community.”
“Looking forward to meeting people here and connecting!”
- Professional growth or job search: To find or change jobs and access resources that help them build their portfolio or resume, or understand the job market.
“I’m looking for input to refine my career development and job search.”
“I’m trying to find out more about career options in data visualization and whether this is a path I want to follow.”
This was the quickest way for us to gather just enough information to understand user goals. With a clear picture of what our members needed, we had the groundwork we required to tackle the site’s design and content. But before anything else, we had to solve the most complex element of the website: the navigation menu.
Rethinking the navigation experience
Over the years, more and more content was added to the site, and eventually the menu lacked focus. This structure created friction for our audience. In our website user experience survey, members made their frustration clear:
- “Sometimes I’m expecting to find more complete information within the menu options, and I do sometimes find it a little difficult to find what I’m looking for.”
- “It’s overwhelming! And even though there’s a menu, things feel a little bit all-over-the-place. I think it just needs to sit down with a UX designer to re-envision how people interact with it and find information.”
- “I navigate to the website most often from the email newsletters.”
Let’s look at the old menu to understand why it needed an update. Here were the options:
- Home
- Memberships
- News
- For Members
- Programs
- Nightingale
- Jobs Board
- About
Referencing our findings from user research, where would a member go to learn about data viz? Maybe Programs? We had a resources page, but it wasn’t linked in the menu. What if they want to join events to build new connections? Under Programs, we had an events calendar, but we also had a Slack community that was hidden under For Members. The menu was not intuitive and categories did not always make sense. So we reorganized and reduced it to six items that aligned more closely with user goals:
- Start here: A series of comprehensive guides that curate resources based on three different levels of data viz experience: new, familiar, or expert in data viz.
- Learn: For anyone looking to gain knowledge and advance their skills in data viz.
- Connect: From local meetups to our flagship conference, there are many ways for members to build meaningful relationships.
- Jobs Board: Data viz jobs board that is free for anyone to post and search opportunities.
- About: Everything you need to know about DVS.
- Become a Member: Lists DVS’s membership benefits and how to register.
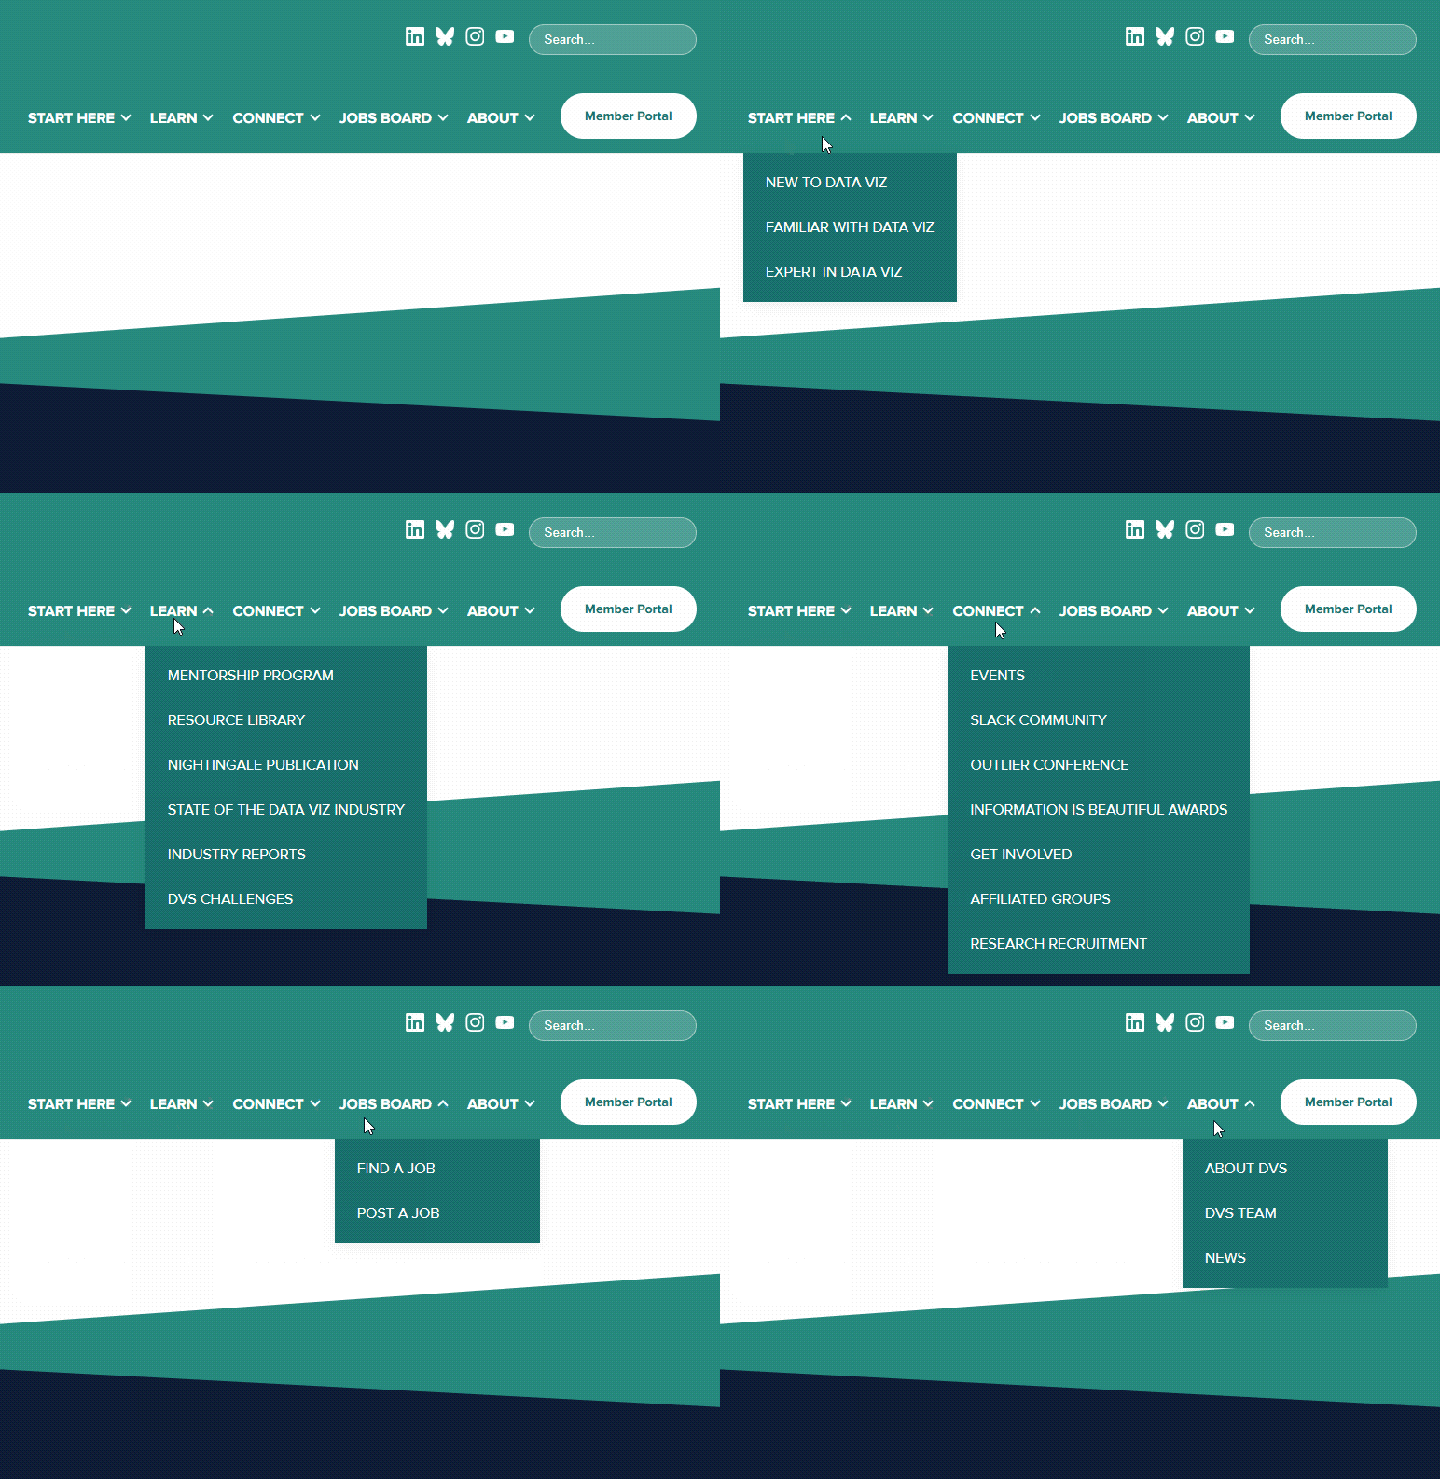
Not only is the new menu easier to understand, it’s also more meaningful. There is less confusion about where to go if you want to learn about data viz, attend events, or find a job.
Centralizing high-quality resources
Besides navigating a bulky menu, our members needed a better way to navigate our resources. They were scattered across different pages, often buried several layers deep. Here’s what we heard from members in a survey about the website:
- “… there are so many great resources that are shared in Slack, it would be awesome to have them all in one place.”
- “A curated resources library would be incredible—for example, where to start if you want to learn a certain program.”
- “More learning resources and opportunities for those of us who have been in the field for a few years (not beginners) but want to up our skills.”
New members have regularly expressed feeling overwhelmed with what DVS has to offer. Whether it’s building a toolkit or identifying courses to enroll in, it’s difficult to know where to start. So we built Data Viz Pathways and the Resource Library, with 1,000 entries (and counting). Created by DVS board members Isobel Parkes and Cedric Lary, Data Viz Pathways offers comprehensive guides at three experience levels:
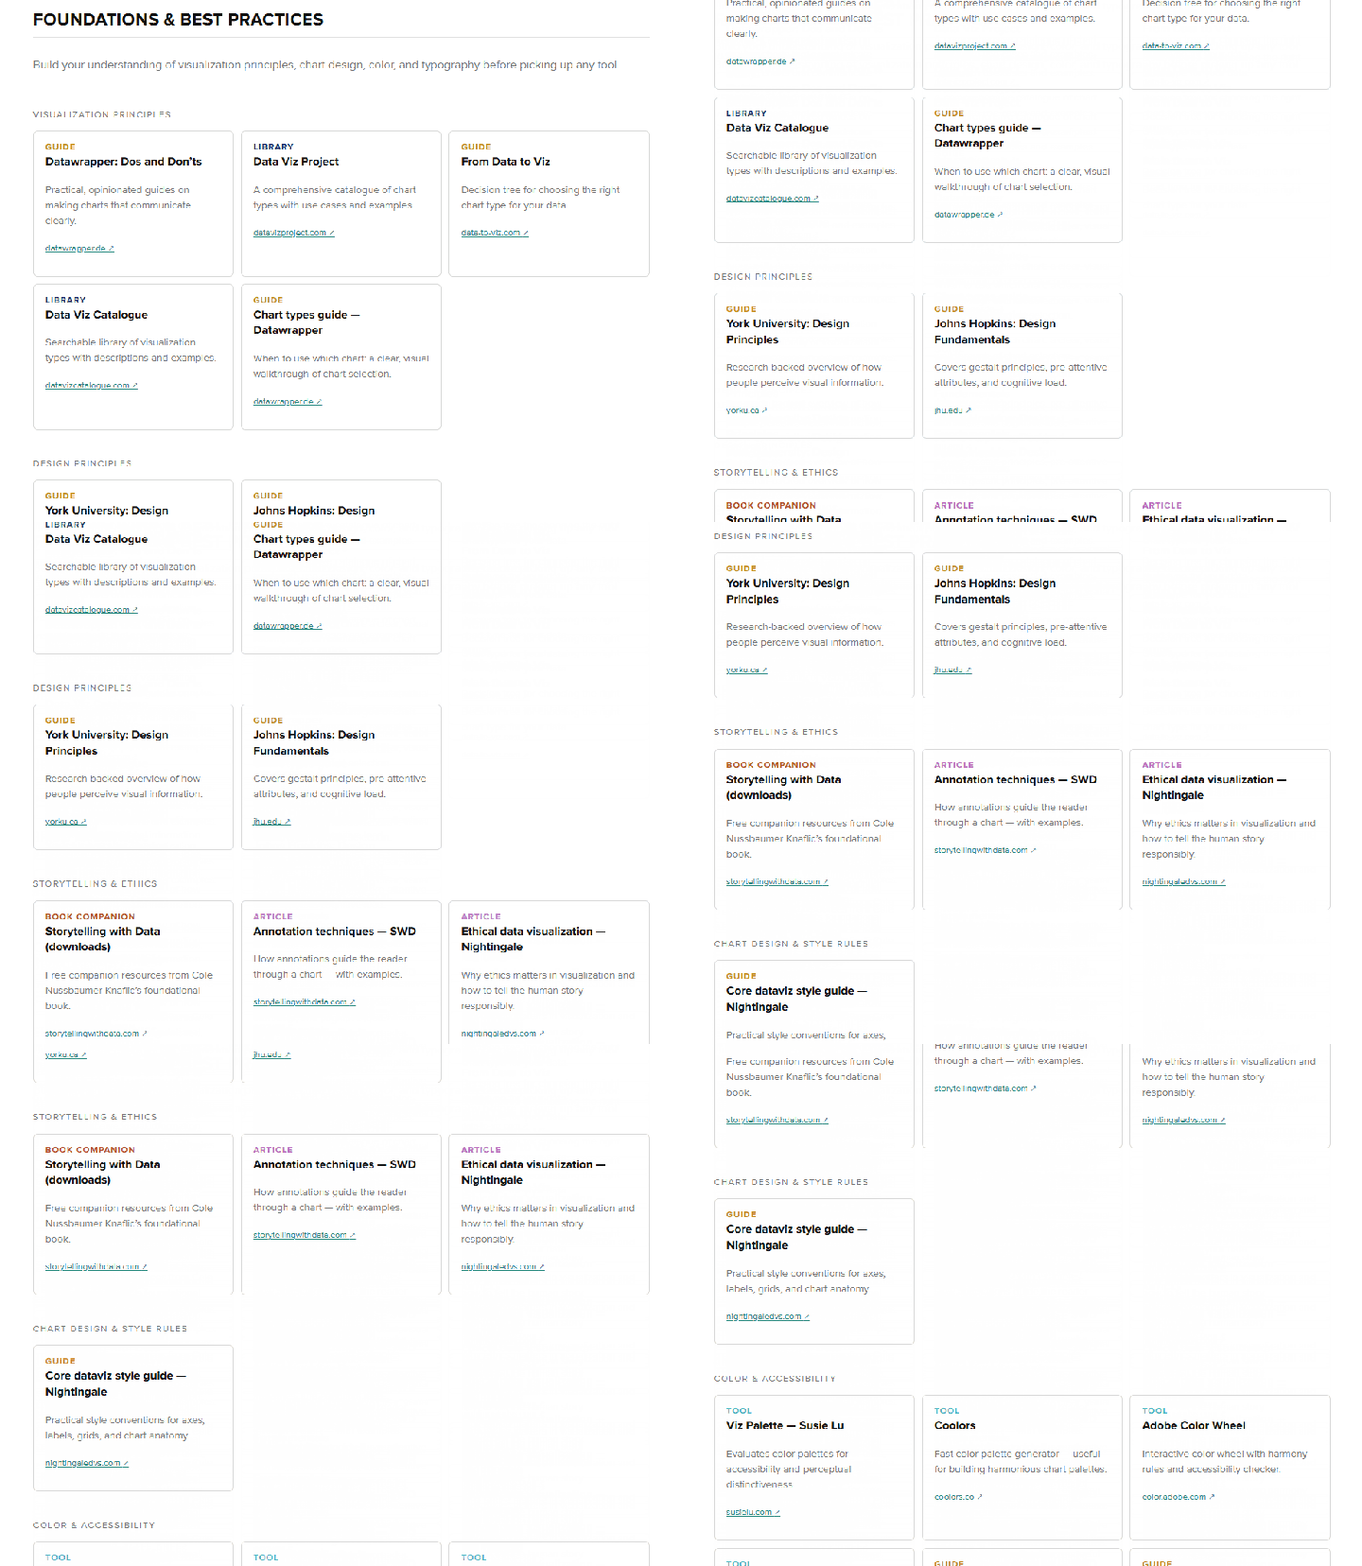
Most people fall into the first group—perhaps they’ve just graduated from school or want to pivot from an adjacent field. The beginners’ guide covers everything from visualization principles to toolkits to datasets. It’s the best place to start for anyone new to data viz.
The second group is where we have seen a huge gap at DVS and anywhere else offering data viz education—once someone has a grasp of fundamentals, how could they take their skills further? There are few courses available for intermediate learners, so we’re proud to have created a dedicated guide that goes beyond fundamentals and dives into popular areas of data viz: data journalism, business intelligence, spatial mapping, and creative coding.
People in the last group have already refined their skills and knowledge, and may seek to develop leadership skills or give back to the community. The guide suggests ideas around speaking, mentorship, and leading local meetups to support budding practitioners.

For anyone interested in resources around specific topics or interests, we also built a brand-new Resource Library with not only DVS-created content but also everything created by the data viz community. The library is organized into the following buckets:
- Data viz challenges
- Data sources
- Education
- Events
- Meetups
- Style guides
- Publications
- Media
- Organizations and communities
- Websites and tools

Cedric Lary, our early careers director, shares the process of building the library and curating the resources:
The Resource Library was originally inspired by the Visualization Universe, an interactive tool for exploring charts, books, and tools designed by Anna Vital and Mark Vital from Adioma in collaboration with Alexander Vushkan, Alberto Cairo, and Google News Lab’s Simon Rogers. As the world of data visualization continues to grow, especially in this era of AI, we felt there was an opportunity to help our members navigate this abundance of knowledge—not only the dozens of new resources being created every day but also the thousands of valuable resources that have shaped our field over the years.
Originally, DVS made an effort to crowdsource resources from our wider community through Google Forms and public spreadsheets. Over time, however, we saw an opportunity to bring greater structure and care to this process. Resources were sometimes added without curation, leading to duplicates, broken links, and valuable resources becoming difficult to find. With the Resource Library, our goal was to create a sustainable, growing repository where resources could be thoughtfully curated, easily searched, and preserved for our community. We wanted to make it easier for members to discover high-quality resources while also celebrating the people and organizations who created and shared them.
Our collection process began with the resources DVS already offered, including member-exclusive content and public resources like those available on our YouTube channel. Through this process, we learned which information was most valuable to track and developed a system for organizing and tagging resources. We then expanded our search to include member-curated resources, surfacing hundreds of additional resources from contributors and communities across the wider data visualization field. Danne Woo brought these efforts to life by creating a custom WordPress plugin that allows our team to quickly review, approve, and update resources while giving community members the opportunity to upvote their favorites.
The curation and classification process was time-consuming, but it was also a reminder of just how much knowledge and creativity exists within our community. As we searched, we encountered countless incredible resources that had been lost, no longer maintained, or discontinued altogether. That experience reinforced for us the importance of preserving the work that has helped shape our field and making that work easier for future data visualization practitioners to discover.
We see the Resource Library as a living archive, one that will continue to grow alongside our community and our field. We will continue expanding its collection and developing new features that make it easier to share the resources that make data visualization such an exciting and creative field. Stay tuned for future updates!
—Cedric Lary, early career director
Centralizing our resources addresses a long-standing request from our community, making it effortless to discover books, courses, and events. With that foundation in place, we’re now shifting our focus to our most visited page: the home page.
A new home for DVS
In my experience, the home page is one of the most difficult pages to design. First impressions matter, and this is especially true here, where the home page serves as the primary gateway to the site. While our previous version focused mainly on routine weekly events and community updates, we wanted the new home page to offer deeper, lasting value. To make it more meaningful for our members, we added key features designed to foster connection and make knowledge far more accessible.
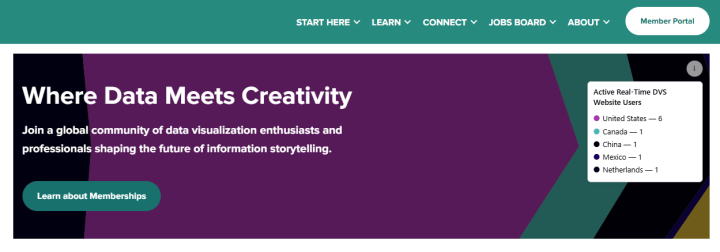
We often joke internally that for an organization advocating for data visualization, our website didn’t actually feature much of it. Reimagining the home page gave us the perfect opportunity to change that by injecting some custom data viz directly into the design. Danne Woo, our lead developer, built a dynamic visualization that maps where site visitors are joining us from in real time. Prominently featured in the hero section, it immediately fosters a sense of global connection and highlights just how diverse our community really is.
News feed

The ecosystem of what DVS offers can be complicated, and members have told us it was difficult to stay on top of our updates. There are separate sites for Nightingale, the Outlier conference, and the Information is Beautiful Awards. It was not possible for us to host them all on one platform. Instead, we built a news feed on the home page that gathers all the updates in one place. Now, you can find the latest news, events, and articles on our home page. Inspired by how news sites bring content forward, Jocelyn Fung shares how she designed the home page:
“The layout of the home page is meant to expose all the wonderful things that the Data Visualization Society offers. Instead of building a static page where visitors need to hunt for the latest updates, I took inspiration from news sites and brought everything forward. DVS members have diverse interests and backgrounds, and with new content every few days alongside the rich resource archives, there is something for everyone.”
—Jocelyn Fung, website designer
Member spotlight

Our members all come from different walks of life and have incredible stories to share about how they started and why they joined DVS. Connection and belonging are an important part of what DVS offers, so our member spotlight brings that to life.
While these front-end features define the user experience, the real heavy lifting happened behind the scenes. Migrating from Squarespace to WordPress proved to be our single biggest technical challenge, and the work on the back end was where the real complexity lay.
From Squarespace to WordPress

We made some big changes on the back end for a better editing experience that was less bulky, more cost-effective, and allowed for more customization. Danne led the migration from Squarespace to WordPress because it was necessary to keep up with DVS’s growth. Here’s what he had to say about the process:
After starting my position as education director on the board of directors at DVS, I decided to do a deep dive into the organization’s digital infrastructure and quickly realized that DVS had outgrown its current online platforms, and that the main website, secondary websites (i.e., the jobs board, Outlier, Nightingale, and the IIB Awards), and vast resource database would all benefit from an overall rethink and rebuild. The DVS and Outlier websites were both built using Squarespace, which is a great platform for displaying basic information and worked well during the organization’s infancy. But as DVS has grown, so has our need to go beyond what Squarespace’s platform allowed. Because of this, we made the decision to rebuild the new DVS website using WordPress as our content management system (CMS).
This move also stems from the fact that DVS was already comfortable using WordPress, considering Nightingale and the jobs board were both already using this CMS. Moving to WordPress allowed us full customization, which meant we could add more features, resources, searchability, filtering options, digital consolidation, and generally provide a better user experience for our members.
Another benefit is the ability to house our content in a more centralized location: We have brought the jobs board, Outlier website, resources database, and Nightingale articles to the main DVS website, allowing members to search through all DVS-related content on one website. Being on WordPress and allowing for much more customization will also allow our digital infrastructure to continue to grow with our ever-growing membership and community. I am excited to have our members be able to find all the resources and information that they are looking for more easily and take full advantage of what a DVS membership offers!
—Danne Woo, lead developer
Although WordPress came with a steeper learning curve than Squarespace, it was well worth the switch because we could offer so much more in one central location. The Data Viz Pathways and Resource Library are highly customized pages that would not have been possible to build in Squarespace. We’re extremely grateful to have Danne on the team to support the transition and ultimately create a more seamless website experience for our members.
From my data viz journey to yours
Data viz has given me opportunities I could never repay. It showed me how boundless human creativity could be and how generous we could be with knowledge. Everyone I have met in this field wants to see others succeed. They experiment with tools and processes, document them, and share them—all in the hope that someone else can benefit from it. It’s a community that keeps giving back. My first job was working in data viz, which led me to DVS and then to a career in communications. I could not be more grateful for what data viz has done for me. This project was more than a website; it was my way of giving back. All the ideas, features, and decisions that went into the website came from the time when I was new to data viz and ready to learn as much as I could about it.
To be honest, I didn’t feel confident leading a project so big in scale. But I knew the community well and understood what a good website looked like, which gave me enough courage to take it on. Interestingly, my background in data viz gave me a strong foundation in graphic design, development, and UX design. All these skills came together so I could speak to the different parts of building a website. Data viz is truly an interdisciplinary field where generalists thrive. No matter where you are with data viz, you can’t go wrong advancing your knowledge. Beyond building in-demand technical skills, you learn how to tell compelling stories and drive decisions. We hope that our new site serves as a guide for anyone who has an interest in data viz. Explore our new site today to see how you can elevate your data viz skills, education, and career.
Acknowledgments (a.k.a. the village)
This project would not have been possible without the support and countless hours from volunteers and DVS team members. We’d like to acknowledge everyone involved:
Danne Woo—lead developer
Cedric Lary—content creation
Isobel Parkes—content creation
Jane Zhang—project management
Hailey Hannigan—user research
Brittany Whitsett—content development
Jocelyn Fung—design
Jèf Davis—design
Qingyue Li—design
Angela Li—design
Aremi Manrique—design
Zezhong Wang—design
Janessa Webb—design
Bayu Prahara—design
Carol Santos—design
Priyanka Gajera—design
Lorena Jocou—design

Jane Zhang
Jane is a data designer turned communications specialist based in the Greater Toronto Area. She regularly shares her professional experiences on her blog and at conferences to advance the field and expand the community's knowledge, leading her to work for organizations in education and professional development. As the Communications Manager at DVS, she brings her experience in design and marketing to help the data viz community grow. You can see her work and writing at janezhang.ca.


