
The article was written by Alexey Pomigalov, PhD in history and curator of the DataArt IT Museum, in April 2026. It draws on material prepared for the recently published online project https://retrospect.dataart.com—a dedication to the millennia-long evolution of data processing and the creation of data-driven culture.
A woman from a Stone Age tribe somewhere in southeastern Africa was sitting on a rock, stargazing and wondering whether she would be able to recognize tomorrow’s night sky from tonight’s. Imagine her the next night, recognizing the sky—something had changed. The big white circle had shifted—and was not a full circle anymore! Her interest was growing, so she continued coming to the same place and watching the sky each night. She had that feeling of precognition, that eventually the circle would be full again, just as it had been many times before. She decided to count. So she would not forget, she marked each night with a notch on a bone she found lying around.
Women-counters of the Stone Age (observation, abstraction, and external memorization)
Modern anthropological studies, together with forensic science, DNA analysis, and bioarchaeology, have shown widespread female participation in all types of activities—well beyond the role prescribed for decades by the formula “Man the Hunter, Woman the Gatherer.” In fact, it was women who presumably started to count lunar cycles and to predict processes within the body and in nature.
As society and human activities grew more complex, women long kept the role of human computers. Yet, patriarchy was not interested in keeping all the names and events, and erasures occurred quite often. Some women are known (e.g., Florence Nightingale), but many remained invisible, creating and preserving our civilization. Even the first excavated counting tool, a baboon-bone tally, was initially assumed to be made by men, though perceptions and theories have changed recently.

While often assumed to be a tool for hunters, anthropologists now offer another theory: This baboon fibula with 29 distinct notches was likely a lunar calendar created by women.
This object challenges the idea that “data” began with commerce or war. It suggests that data began with biology and creation.
The first “database” was a tool to track the most important recognizable patterns—cycles of life. And life itself became the very first reason humans felt the need to record, measure, and process. These recordings began evolving as more life-related matters became countable, and eventually they became vital for life-or-death decisions, such as maintaining water and food supplies. Finally, records became so complex that the ways to process them had to evolve as well, and so the methods for interacting with the data in those records continued to be developed, though the meaning was the same—to endure in a changing environment.
This was the point at which humankind began the “data civilization.” Counting and storing the results on the external memory storage became the foundation of a whole new reality. Already recognized patterns were described, recorded, and could be used again.
Tablet with a table for a brewery (representation of essentials supply records)
Let me put it in rows and columns—that is how it will be able to show the peculiarities and interconnections.
That was probably the prompt the ancient Sumerian executive used on himself while putting down the accounts of deliveries of barley and malt from two individuals for beer production.
Today, tabular representation of information feels almost eternal—our generation, at least, uses it every day in every field. But how did it come into use? It actually feels as important as the invention of the wheel!
The earliest known spreadsheet representation of numerical information is a clay tablet with early proto-cuneiform inscriptions. It was found in the city of Uruk (Warka), considered one of the earliest urban areas of Sumerian civilization in modern-day Iraq. The tablet dates back to around 3300–3200 BCE. The item is now on permanent display in the Department of Oriental Antiquities at the Louvre in Paris.
The archaeologist Robert K. Englund managed to decipher the tablet. He concluded the full-round figures meant barley groats, and the blank sectors with bold lines were for malt. These are considered standard symbols for grain counts in administrative inscriptions.
It is also worth noting that this tablet, along with similar accounting inscriptions, was found on archaeological sites among rubbish and floor fillings, yet it represents the earliest data processing in modern human civilization.

The idea of how data is structured changed everything—the spreadsheet became the ultimate readable form of correlated data, both for humans and, eventually, for machines.
Library of Alexandria and cataloging knowledge (interface creation and data marking)
One of the most important things about data is probably not what it means, but where you can find it: what cell it is written in, and what the address is. References to sources mean everything in the academic world. And this seems to be one of the main skills of our civilization—to describe where to find the necessary information or data, and to create a readable map or a comprehensible description of the exact location of the record.
The method widely used today in Western libraries was developed by the bibliographer, poet, and researcher Callimachus of Cyrene, who worked in the most famous library in the world—the Great Library of Alexandria, in Ptolemaic Egypt, a Hellenistic kingdom in 305–30 BCE.
He compiled tablets of writings, named pinakes, which contained information such as a title, author’s name, place of birth, father’s name, any teachers they trained under, and educational background, as well as a brief bibliographical summary.
It is thought that there were 120 pinakes, or tablets, describing the library’s entire collection. The collection held over half a million papyri (plural for papyrus), sorted in containers and stored on the shelves—the pinakes created by Callimachus hung nearby for reference.
Unfortunately, the pinakes were destroyed along with the collection, but we know about them from mentions in contemporary sources such as Aristophanes of Byzantium (a student of Callimachus who later became head librarian).

Archaeologists and historians of the Hellenic world suggest that the same system was used in another great library of the time—the Library of Pergamon, and later it became common for cataloging knowledge in the Mediterranean region. The Pinakes system persisted into the nineteenth century, when it was updated and standardized.
The word pinakes originally meant a board hung on the wall with a painted object, a terracotta ornament, or anything intended as a votive or sacred object. And it is the word that gave rise to collections of paintings, such as the Pinakothek in Munich.
The volume of knowledge grew and the need to retrieve information became as vital as recording. Each unit of information was assigned an address, making the data navigable. This principle of physical indexing laid the conceptual foundation for modern digital storage architecture.
Coding reality for the Industrial Revolution (implementation of abstract idea over and over again)
Over time, human observations revealed the numerical basis of reality, suggesting that it could be simulated or programmed, if only in fragments and only within the limits of our tools. Automata and cathedral clocks show the spectacle of processing. These devices staged order in public, encoding rules in gears and rituals. They remind us that before computation was practical, it was performative—a demonstration of control over time, matter, and imagination. The next leap took this spectacle of control and turned it into production infrastructure: the Jacquard loom.
In 1725, a textile worker from Lyon named Basile Bouchon adapted an approach from pinned music automata to control weaving with perforated paper tape. It was a subtle revolution: a machine that could remember patterns. This innovation marked the dawn of externalized memory, symbolic data storage for controlling machines.
In 1804, Joseph-Marie Jacquard refined this concept into a fully automated loom using punched cards. Each row of perforations controlled which warp threads were lifted, encoding textile patterns in binary sequences.
These punch cards introduced the principles of repeatability, modularity, and the functional separation of logic from physical mechanics. By executing structured data to govern its behavior, the loom was transformed into a programmable system. This novelty directly inspired Charles Babbage, who applied Jacquard’s logic to mathematical computation in his Analytical Engine. Consequently, the core of textile control evolved into the realm of abstract logic.
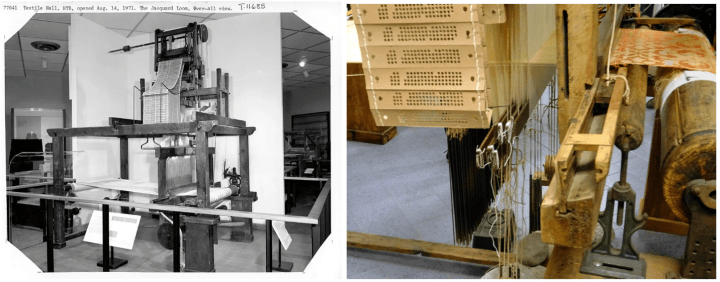
Right: Chain of 8×26-hole punched cards, early nineteenth century. Credit: Riccardo Ortelli, via Wikimedia Commons.
The importance of the Jacquard loom lies less in automated weaving than in abstraction. It marked the moment when patterns became code—transferable sequences that could be stored, reused, and combined. This conceptual leap from art and craft knowledge to programmable logic—treating instructions as independent data—made later computational systems imaginable.
It later resulted in the application of such an approach in the processing of the results of the 1890 Census in the US. This was a breakthrough: Instead of decades of hand processing, a young engineer named Herman Hollerith applied punch cards, inspired by Jacquard looms, the Analytical Engine, and railway tickets, to process the results in three years.
The concept of automating the reading of data records kick-started major changes in civilization, economics, social relations, and technological advancement.
Relational database model and new research approach in humanities (modern data structures for Stone Age data cracking)
In 2010, Genevieve von Petzinger initiated a fascinating research project. Her work focuses on the earliest forms of communication and representation of ideas found in Stone Age cave paintings. She studied the non-figurative geometric symbols that were found alongside figures of humans and animals.
She discovered a major gap in the field: No large-scale work had been done to examine the connections between these signs at different sites. This meant no one had yet asked the core question: whether the repetition of these signs was random or deliberately chosen from a limited set of options.
While early researchers, dating back to the 1860s, drew attention to the enigmatic nature of these symbols, they lacked the tools to fully investigate them. A later scholar, André Leroi-Gourhan, working in the latter half of the twentieth century, believed he was seeing patterns in the imagery. However, his focus remained on the internal structure of individual sites, and he did not have access to the computer programs she used for her analysis.
The crucial game-changer was the application of relational database software. It processed all the signs she found from 146 French rock art sites spanning several time periods between 35,000 and 10,000 BCE. As a result, the researcher identified 32 distinct non-figurative geometric shapes (in earlier studies, she mentioned 26). Using this identification, she continued the study, looking for patterns and continuity across time and space. She herself highlights that modern computer technology and software enabled her to conduct such extensive research.
While many people considered the signs a form of writing, von Petzinger herself has her doubts. She does not believe the signs were a complete system with the structural elements of grammar. Instead, she saw them as a foundational step in how our ancestors communicated in a physical form. From a linguistic perspective, this behavior is often seen as the very first stage of writing and is typically categorized as either an ideographic system or an iconographic system.
What is peculiar is how this research shows that data and art arose together. While cave paintings are considered the earliest form of art, Genevieve von Petzinger’s work reveals that the non-figurative symbols within these artworks were likely a form of communication, transmitting data through an extraordinary means.

The realization that abstract mathematical models could be applied across disciplines, including the humanities, broke down the barrier between scientific research and the arts. This universal applicability of data science has opened new horizons for human curiosity, allowing us to quantify and decode aspects of our lives that were previously uncountable.
A woman from the first half of the twenty-first century is sitting in the office and cracking the massive dataset of grouped notches on the relic bone. She uses all available tools and agents. The result will not change the lives of humanity, though she understands that data is what we invented and encoded to transmit through millennia without even knowing the recipient: “Recount, Sort, and Figure Out!”

Alexey Pomigalov
Alexey Pomigalov is a historian with a Ph.D. and an extensive background in arts and cultural research within classical museums and institutions, who now explores the intersections of media archaeology and the anthropological history of processing the world. As a curator for the DataArt IT Museum project, he studies and showcases the peculiar details of computer and data processing history and their influence on civilization, often looking beyond mainstream narratives of computer history.


