
In early September, I had a super fun time at a Meetup with the Denver Data Storytellers at the Denver Museum of Nature and Science!
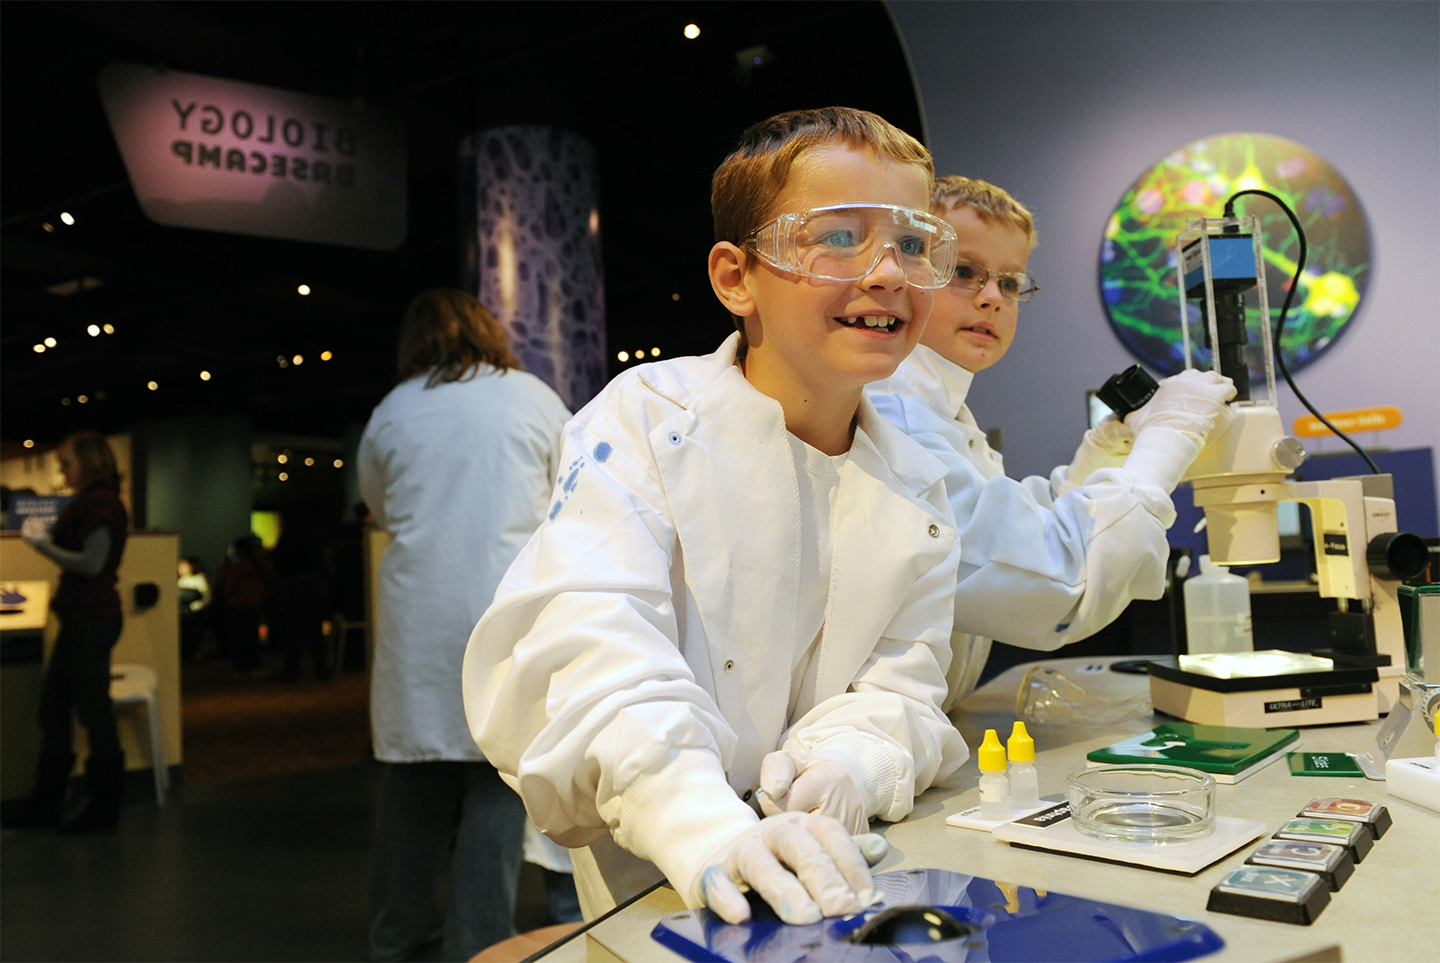
The museum has several interactive exhibits. One permanent exhibit is Expedition Health ®, and it’s all about health and the human body.
At the start of the exhibit, you get a plastic swipe card. On a touchscreen monitor, you insert the card and enter in some information about yourself, then you select a virtual buddy to join you as you travel through the exhibit.
At stations throughout the exhibit, you slide in the card and interact with the station. One station takes your heart rate, one measures your height and wingspan, and another is a game to explore how well you interact with mirrored images. There’s even a Mindball game where you try to move a ball along a track with your brain waves! The stations collect your data and show you a summary of your measurements, sometimes in comparison with your buddy.
At the end of the exhibit, there’s another bank of touchscreen monitors. Here, you slide your card once more and get a printout with your personal data. Due to the interactive exhibits and the nature of the data, every visitor has their own personal experience and souvenir of their day at the museum.
This visit reminded me that when data is personalized, the audience is more likely to engage with it. You can apply this to dataviz by highlighting the metric or category most relevant to your audience to help them see themselves in the data or by offering filters in interactive dataviz that allow audience members to find themselves in the data. The incorporation of a buddy into the exhibit interaction added a peer engagement component, which also helps with engagement and understanding of data.
If you’re looking for ways to engage your audience in your next dataviz or just some general dataviz inspiration, I recommend a trip to your local museum!

Jenn Schilling is the founder of Schilling Data Studio, a data visualization training and consulting agency. She has a decade of experience applying data science and data visualization in a variety of industries, including supply chain, market research, and higher education. Jenn loves telling compelling stories with data and teaching others how to create impactful visualizations.
- Jenn Schilling

- Jenn Schilling

- Jenn Schilling

- Jenn Schilling


