
This article is part II in a series on data exploration, and the common struggles that we all face when trying to learn something new. The previous article can be found here. I’ll be using the tools data from the State of the Industry Survey as a basis for this exploration, to illustrate both how I approach a new project, and the fact that no “expert” is immune from the challenges and setbacks of learning. In addition to working with a new dataset, I am also using this project to take my first steps toward learning R. Let’s see where this journey takes us!
Before diving into a project where I’m likely to get diverted or distracted, it’s helpful to take a moment to get a clear idea of what I’m working toward. A design brief helps to clarify my thoughts and it gives me a reference point to check against as I evaluate tangents and new opportunities that come up during the exploration phase. It can also be helpful as a framework for evaluating success, and as a way to structure feedback and evaluate input from other people. I don’t always write this down, but I find it helpful to have clear objectives from the start.
Design brief:
Here’s a rough outline of what I’m trying to achieve in this project.
Project Scope:
- Design a chart (or group of charts) to showcase a single 2020 survey question about tool usage, and to provide insights into the skills needed in different careers.
- For now, I will focus on the tools question exclusively, though there are many interesting questions correlating this information to other survey questions that might be worth considering in the future.
- This is an exploratory project, so the final output and mechanism of delivery are to be determined.
Context:
- This visualization is part of a larger project to leverage the DVS survey data to inform people about different career paths.
Audience:
- DVS members and Nightingale readers.
- People working in dataviz who are curious to see what tools others use.
- People new to dataviz who want to understand what they should learn next (especially if they are interested in a particular career, or comparing different careers to find a match for their interests).
Purpose:
- To understand which tools are most popular, and which sets of tools tend to be used together.
- To find out how much tool usage varies between professional communities.
Data:
- Data from the 2020 DVS census, hand-tagged to different career groups by job title.
- The first four career categories account for roughly ⅔ of the data. Business analysts and related roles are the largest group, at almost 36 percent.
- 1,766 individual data points, with 33 tools (plus an “other” category) listed in the dataset.
- This survey question is not exclusive; respondents can choose more than one answer.
- I am not doing anything to remove or track incomplete responses at this point.
- The “other” category in the original question is excluded from this analysis, since it is a free-entry field and harder to process (a future version should include this data as well).
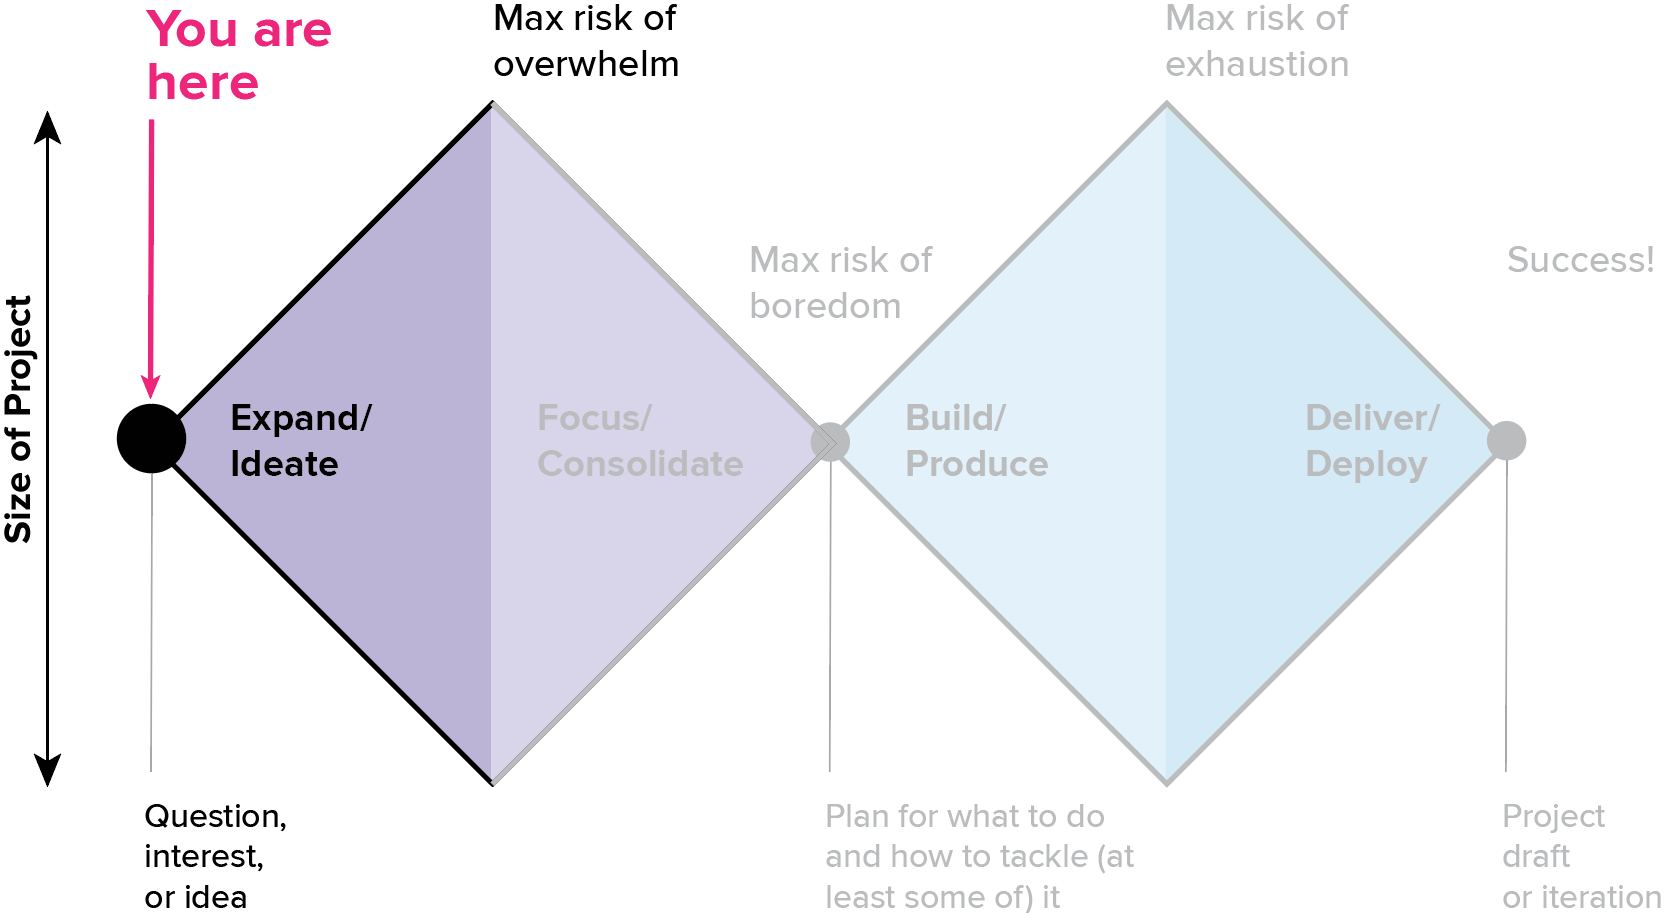
Once I know what I’m trying to do, the next step is the fun part: getting in there and understanding what this problem really looks like. This is the “expand” stage, where I take some time to get oriented, understand what the data is all about, and play around with some initial ideas. This stage is especially critical when you are working with someone else’s data. You want to find all of the gotchas and limitations lurking in the data before spending too much time on a formal analysis. I’m also looking to assemble a strategic view of where I’m going, so that I know where to spend my time in the much slower, higher-effort “focus/consolidate” step that comes next.
Practices for exploration
For me, the most important principles of the exploration piece of the expand phase are the following:
Do what’s easy
I’m trying to learn as much as possible about the problem without getting too bogged down in the details or impeded by my tools. Right now, I just want to rummage through as many aspects of the data as I can, to identify which ones might be promising enough to come back to later, and to anticipate the dead ends.
What that looks like for me right now is a tiny bit of analysis in R to export a spreadsheet, and then a whole lot of manual playing around in Excel to figure out how I want the bits to work together. I’d do that in R if I had the skills, but I don’t (yet…that’s what I’m learning!). For now, I’ll use R when I can, and when I can’t, it’s good old elbow grease in Excel to fill in the gaps. I’m leaving the hard work of learning new software for later, when I have a better idea of what I need, and a better sense of the data to help me sense-check my results. The price for that will be hours spent doing things inefficiently in Excel, but the tradeoff is worth it to me right now, especially because it’s easier for me to check my work and debug data issues in software that I know well.
I’m using Illustrator for the charts for several reasons. I’m already familiar with it, I want the flexibility to sketch and ideate on top of basic data points and visual forms, and the actual data values aren’t all that important to me right now. The data points will all need to be carefully recalculated and analyzed for the final version anyway, so everything in this file is subject to change, and should be thrown out. Knowing that gives me the freedom to ignore “little” things like axis labels, and just dump in screenshots and notes to help myself re-connect the dots later, instead of spending days building out charts that I know I will throw away. Is this best practice? No. Is it ok when you’re sketching? In my opinion, yes – if you know how to structure your notes and your process so that you can pick up the pieces later.
One important caveat: this approach works well in a case like this one, where I am doing multiple straightforward analyses off of the same dataset (lots of pivots, but using only two source data tables, and few calculations). I am not building a big, complicated analysis where each step depends on the result of the last. If you have a sequence of analyses that affect one another, it is almost always better to build out and thoroughly test each one before moving on to the next. You might still do some sketching and ideation to make sure you understand the paths and the steps that you need to take, but you should always be more careful when working with code or analyses that have strong dependencies.
Sketch first
You may be thinking that this is a sloppy, imprecise way to work…and you would be right! To me, that’s actually sort of the point here. I don’t want to get in too deep and start taking myself seriously before I know what I’m after and where I’m going. In my experience, an analysis that looks like it might be finished is a lot more dangerous than one that is clearly a mess, because it’s easy to forget that “one little thing” you needed to do when you came back. I used to tell my students that the best way to avoid plagiarizing was to never copy and paste (or even paraphrase) someone else’s sentence into your document. Once it’s in there, it’s really easy to forget that you need to go back and make a change, but a big block of [add something interesting here later] with a link to your references file is something you’re not likely to miss in the editing phase.
I find that the same thing applies to charts. If I make a chart that looks “real” in Excel and I skip a step in the data analysis for the sake of time, I’m much more likely to end up with an error in my final dataset. I consciously prevent that by increasing the separation between the ideation and editing stage (different tools, different files, etc.). This helps me to avoid getting bogged down in the details too early, short-circuits perfectionism, and gives me the room to move freely while I work through the big-picture strategy for a project. Sometimes, it also means that I make mistakes, but I can usually live with that. This approach only works if you have the discipline to really, actually start over from scratch and to resist the urge to copy and paste later. Otherwise, you risk transferring errors and missing gaps that could jeopardize your entire analysis.
Personally, I have usually learned enough by the end of the sketching to more than make up for the time that I’ve lost making messy charts that need to be thrown out. You may find that it’s different for you; in that case, it might be better to stick to pen and paper for sketches, because that’s almost always the fastest way. I prefer the additional detail of realistic data values, but depending on the project, it’s not always necessary, or worth the time. In some cases, my values are so exact that I have to do the full analysis, at high quality, right from the beginning. That’s okay, too. It’s just a matter of deciding what makes sense for you, and for the project at hand.
Leave a trail
This kind of rapid ideation also means that I need to leave myself a trail to make sure that I can come back and re-create each individual step. This practice helps me to make first-draft documentation for the analysis and the project. If I know that I’m going to have to go back and figure out those cryptic notes later, it creates a good incentive not to cut corners on writing things down. I usually just keep a running Word document with a bullet list of changes for each day, notes about file and tab names and locations, and a bunch of screenshots showing different iterations. Use whatever works for you. Writing blog posts is also a really good way to document what you’re doing at a high level, to help make sense of the details in your implementation notes.
Start simple
Sometimes it’s hard to resist the urge to dive right in on the newest, most interesting thing, but I find that it’s much better to slow down and look around me first. Always start simple and work up from there, especially when you’re working with someone else’s data. I am 99 percent sure that I am going to want some kind of advanced cluster analysis by the time I’m done with this project, but it would be a mistake to get impatient and go for that destination right away.
First, I don’t know what I’m doing yet with the R software. I’m much more likely to end up bogged down in questions I can’t answer, frustrated by my technology, and missing out on the actual insight if I jump in right away. Even if I could find a package to run the analysis automatically, I’d have to blindly trust the output at this stage, and that can be dangerous. I never trust an automated routine without first taking the time to understand the method and its limitations, becoming familiar with the data I’m putting in, and getting at least some sense of what I should expect to get out. Otherwise, it’s just a black box and I have no way to evaluate the results.
Second, by jumping in directly I’d miss the opportunity to develop a deeper understanding of the dataset that will help to inform my interpretation of the results. Third, there are tons of other insights sitting right in front of me, just waiting to pop out. If I short circuit the exploration stage in favor of a fancy analysis, I may end up missing the most important thing that this data has to tell me. Like any good warmup routine, a robust exploration phase helps to make sure you’re ready, improves your performance, and prevents injury (mistakes/frustration) when you get into the actual analysis.
Follow the data
My whole job in this part of an analysis is to understand what’s going on with the data. I want to get a big picture sense of counts and distributions, and to see where there is variation between careers. I usually start with the simplest possible question that I can ask of the data, and then work forward from there. I’m not trying to force a particular path or get to a specific outcome yet. Right now, I just want to see what questions come up as I look at the dataset.
Ask more questions
The wonderful thing about questions is that answering one of them almost always creates another. Follow your curiosity and see where it leads. Looking at one chart will usually suggest another idea. As I get into more depth, I keep a running list of more complex questions that I want to come back to and explore. I also structure my output document to reflect the series of questions I asked, so that I can come back later and follow the trail.
A first look at the data:
Here are some of the questions I asked in the first couple of weeks of exploring this data:
How common are the different tools? Which tool is most popular?
My first chart was just a simple frequency calculation for the different tools, plugged into the most basic, default chart possible, to help me see the data values. Adding a simple sort function lets me see which tools top the list.
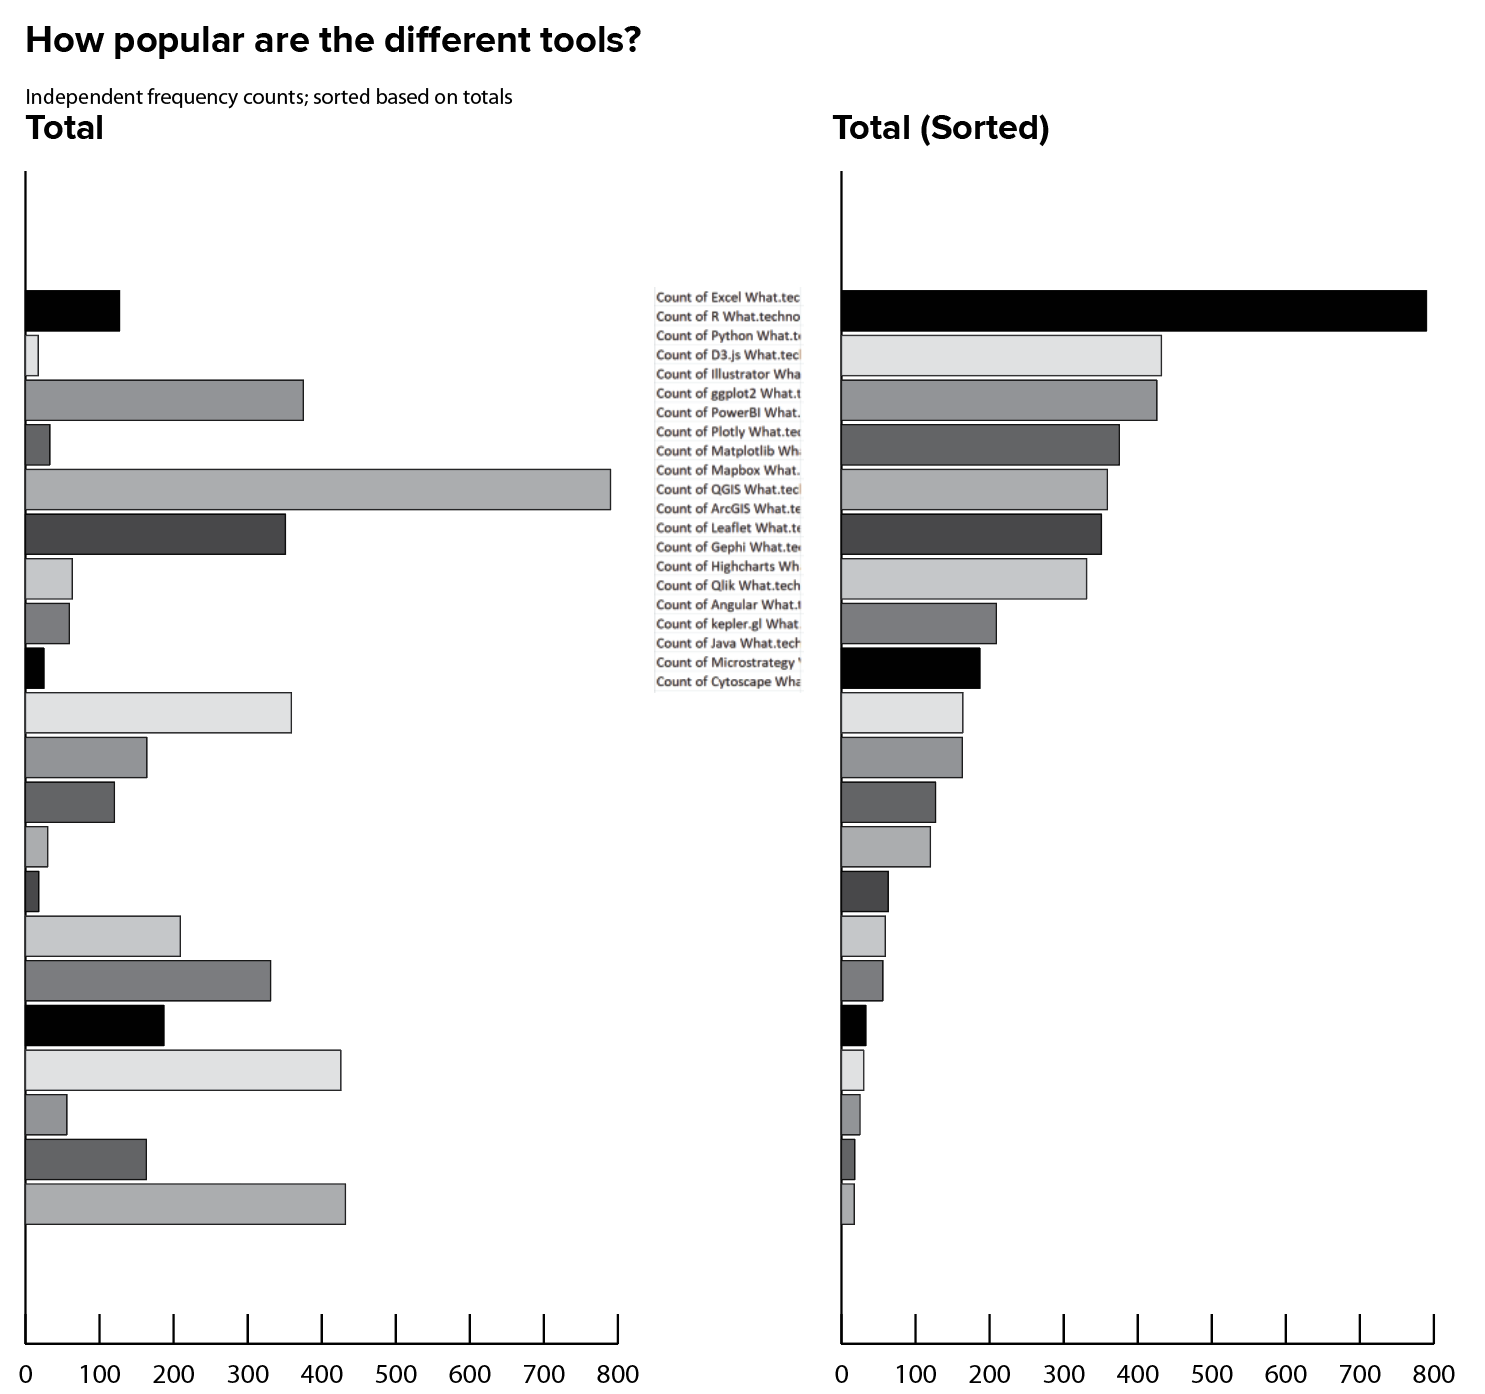
It’s important to note that I’m not looking at specific values right now, because I know my analysis is not robust enough to support that kind of weight. Doing this analysis in Excel required dragging each and every tool into my pivot table by hand; there were 35 of them, and they needed to be added in order, using the same order every time. I decided that I didn’t need that level of detail in this stage of the project. That means that my ranked values are only based on half of the dataset, so I really know nothing about which is the most common tool from this chart. (In fact, this chart is missing Tableau, which is actually the second-most common tool!)
It’s also important to note that the total number of answers in the bars adds up to significantly more data points than people who took the survey, because this survey question allows one person to select multiple answers. I’m not yet doing anything about that multiselect or even tracking its meaning, but that’s worth adding to the list of items that I need to keep in mind as I go.
It’s fine to work with incomplete data right now, as long as I resist the urge to try to draw conclusions or make inferences off of the differences that I see in these charts. I know that I am missing important information in the points that I’m not showing, and that those values could change everything about the conclusions that I’d draw based on the numbers that I see here. Again, I’m just trying to get a sense of the dataset, and I care more about the structure and the kinds of analyses right now than I do about the individual values. Getting too attached to individual values and conclusions can actually be counterproductive at this stage.
This is another reason that I chose not to bother creating and formatting axis labels in my Illustrator document: it is an extra manual step in the software, but it’s also a salient reminder that I can’t count on any of this information to be real. That level of detail comes later, when I’m ready to do this thing right.
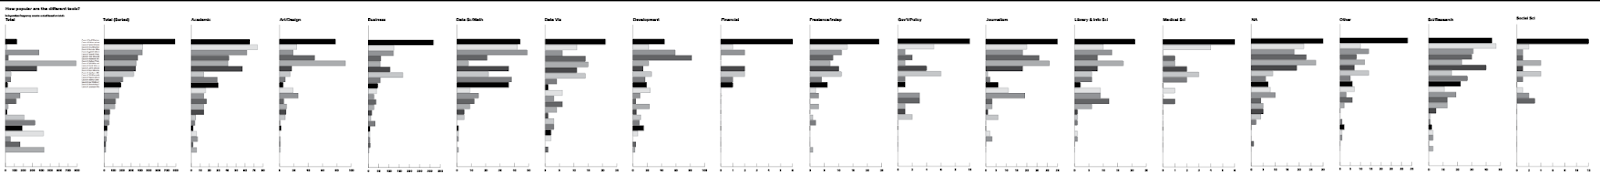
How much does the distribution of tools vary across careers?
Next, I built a copy of my basic chart for each of the different career paths. The first column shows the total for all career paths, and the subsequent charts show distributions for each of the subgroups.
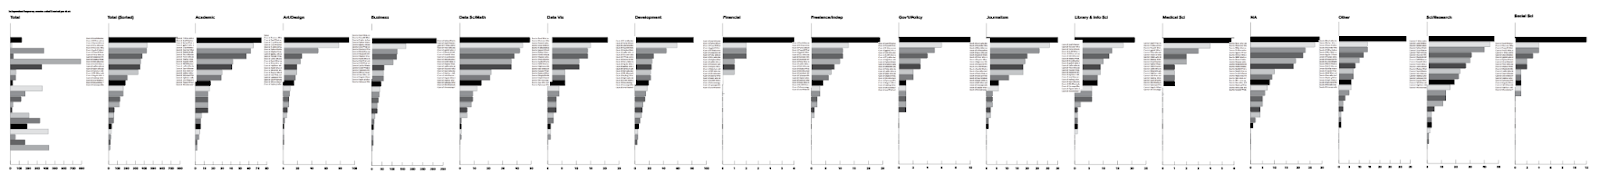
Which tool is the most popular, within each career group?
Again, I can sort my bars by height, to get a sense for the popularity of individual tools. The previous charts all used the same sort as the totals chart, so that I could compare positions across career groups (if Excel was at the top of the totals list, it is the top bar within each career chart). If I want to look at popularity within groups, I can re-sort my y axis as I create each individual chart. I have to be careful here, because this means that my y axis is now different for each chart, which makes my omission of data from these visualizations riskier. Again, I’m deliberately not fixating on data values or patterns yet, and knowing that I’m on thin ice with the analysis helps to keep me out of inference-making mode and in the exploration space.
How many counts do we have for the different career-tool groups?
Another reason to be cautious is that I know from a previous analysis that the size of my career groups is not evenly distributed within the dataset. The charts above are scaled automatically to the max for each dataset, which hides that variation. The second row of charts below shows the first row scaled to a common x axis, set based on the sorted and unsorted totals charts at the far left of the row. Right away, I have a different sense of which differences are meaningful to follow up on; this completely shifts my interpretation of the previous charts. I want to find that out now, before I get attached to a story that doesn’t exist.
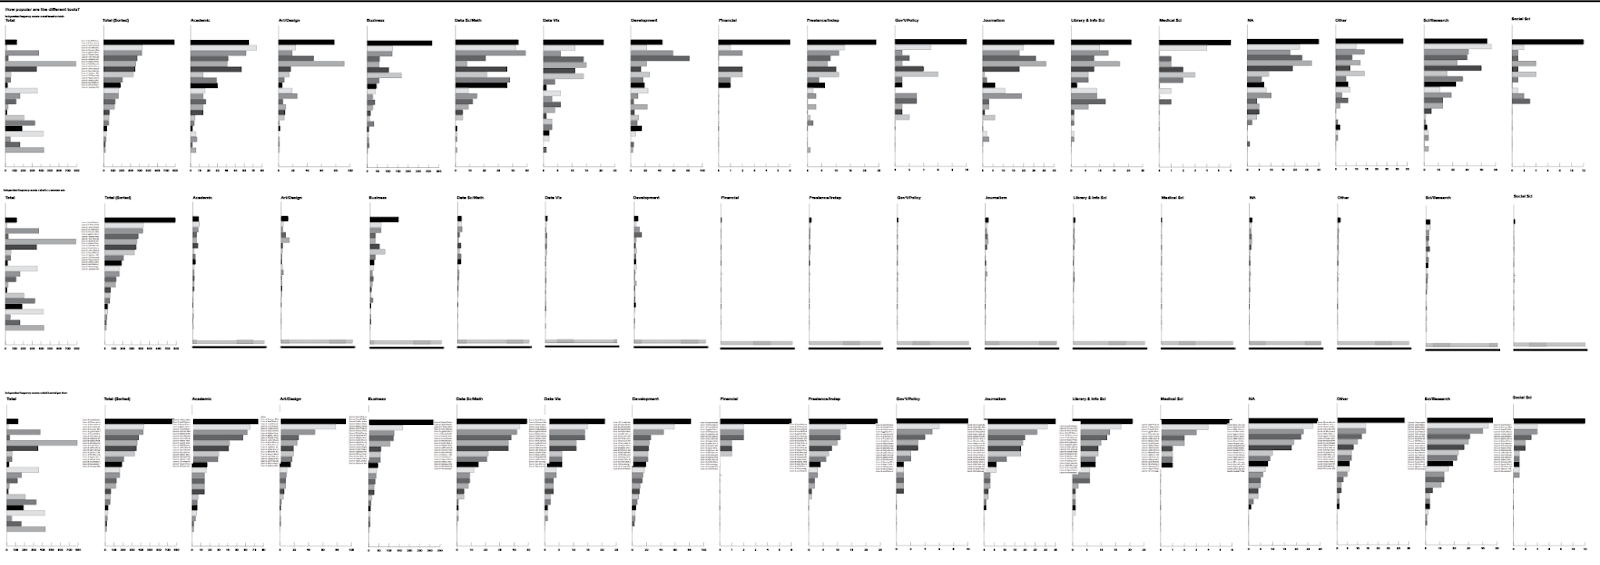
I often use this sort of small multiples approach to help keep me honest when looking for interesting differences, patterns, and trends in aggregated data. If you forget about the underlying counts, you’ll often end up chasing differences that vanish in the final analysis, or drawing conclusions that the data can’t support.
Again, I’m not looking at values here, but what I can see is that there is a fairly long tail for most career groups, and that the shape of the distribution is similar across groups. There are a couple of careers with a shoulder, or with a more abrupt increase in counts for the top few bars, but the careers with the largest differences in distribution widths seem to be the ones with the lowest counts. That makes me wonder if the width of the distribution reflects the number of tools chosen by individuals, or whether it’s actually driven by variation between individuals within each group (everybody picks five tools, but no two people pick the same tool). I can’t answer that question from here just yet, but I’ll put it aside to dig into later, when I’m ready for more sophisticated comparisons.
How much does the top tool vary across career groups?
The sorted bar charts can give me some sense of distribution, but they do a terrible job of helping me to track tool position from one career group to the next. Putting the same data into a different visual form makes that task a lot easier.
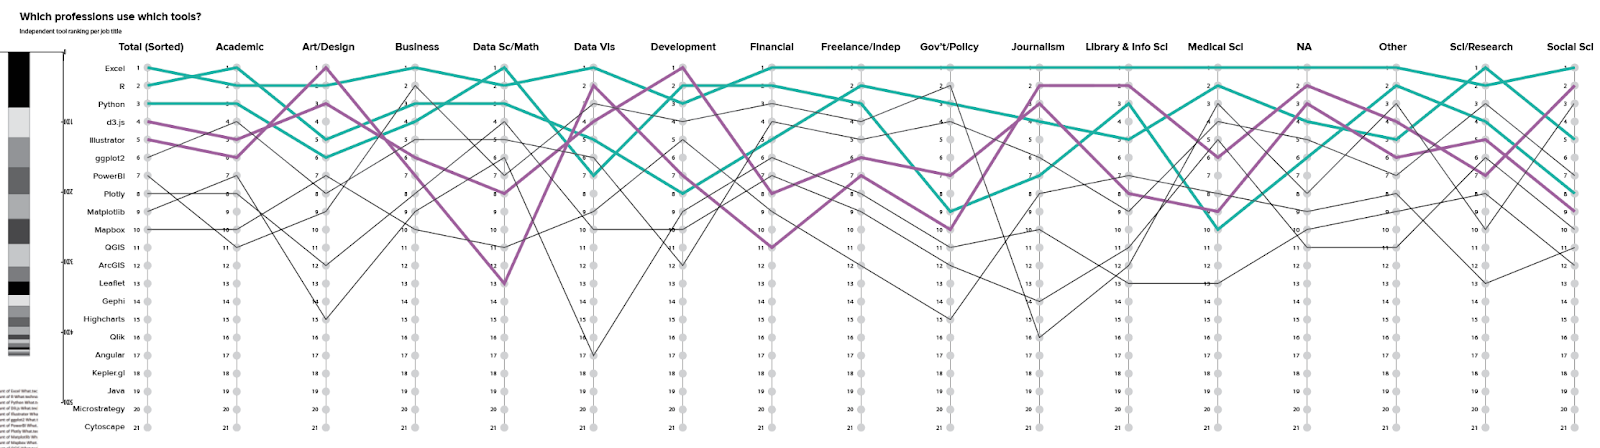
The multiple y plot gets crowded fast, and I didn’t want to draw out all those different connections individually, so I contented myself with drawing lines for the top 10, and will come back and put in the effort to build this out in code later, if it makes the final cut. I added color to the top few lines, just to help me follow them across a busy chart. If I were to build this specific chart out for actual use, I’d want to include animation to support a focus task or to select one or two lines to follow as a single narrative, rather than trying to look at everything at once.
I don’t want to get over enthusiastic with my conclusions here, but there is some interesting variability in the line shape for different tools. Excel stays pretty consistent in the top three slots, where other tools are first for some career groups and not even in the top 10 for others. This might suggest specialized tool sets for particular careers (e.g., designers use Illustrator, developers use d3), and that gets right to the heart of the comparisons that I’m trying to make. This is something that seems worth coming back to, when I have all of the data in place.
I also think that it might be interesting to pull information about the relative size of the different tools into this diagram, in addition to their order in the ranking. I’d like to see how much bigger Excel is than Java, for instance, and if most Java users fall within a particular career group. For now, a quick-and-dirty way to do that is to add a stacked bar chart at the beginning of the diagram, showing the relative proportion of total users for each tool in the chart (in the order that they’re shown in the parallel axis plot). I’d want to do the same for each career, to look at variability in the distribution across groups, but this is enough to remind me to think through that piece when I come back to refine this later.
How many different tools do people use?
So far, I’ve been looking at counts per tool, but it’s also interesting to explore how many tools are listed per user. This is an interesting question on its own, but it will also help me to get a handle on how much duplicate counting I’m doing in the previous charts. One respondent can identify multiple tools in this survey question: if I sum up all of my bars in the counts charts above, I get just north of 4,000 data points, but there are only 1,766 individual responses to the survey, and I know that some of those responses are incomplete.
Fortunately, because of the way the data is structured, getting a count of tools per user is as simple as adding a countA column to the dataset and doing a different pivot off of the same table.
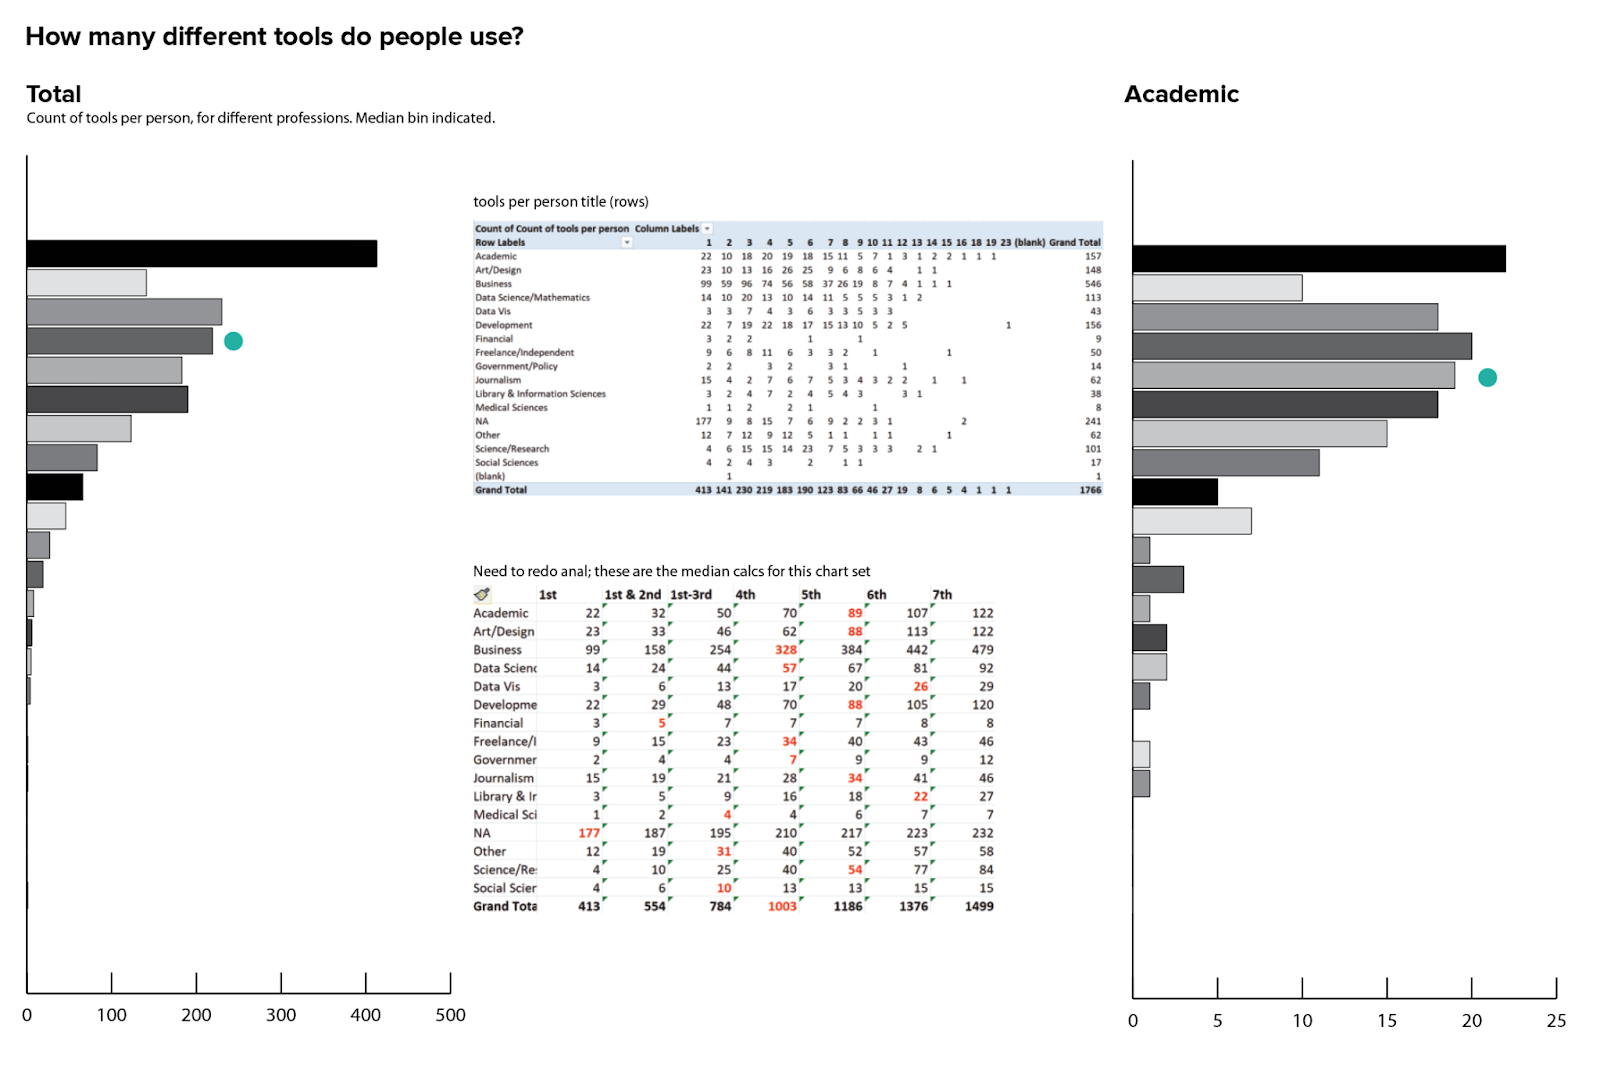
As expected, these curves are pretty asymmetrical: lots of people use just a few tools, and then some professions have a long tail of people who use just about everything. Some professions are much more variable than others, and the length of the tail varies a bit as well. In general, most people identified 10 or fewer tools, but there were also a couple of overachievers who ticked off all of the tools that I measured here.
Another interesting thing to keep in mind is that there’s a strong behavioral component to this data. I’m sure there were a few people who picked only one or two tools, even if they have used many more in their career, and possibly others who dutifully checked off every single tool they’ve ever used. There’s probably some aspect of prioritization, frequency of use, and expertise/familiarity with the different tools that’s not captured here, and we have no way to tell precisely how much those variations affect our data.
This is the difference between descriptive surveys and authoritative research. In a formal research setting, you’d put in structures and practices to minimize variation due to personal behavior or preference so that you could draw firm conclusions about a specific question. That’s not the intent of this survey, which attempts only a broader-stroke picture of tools that people use. It would be fascinating to do a follow-up study to dig into the specifics, but here we can only look at the responses that people provide, and interpret those as best we can. For our purposes, it’s important to remember the limitations of this dataset, to consider the potential impacts and implications of those limitations on our analysis, and to be careful not to overstate our results.
There may also be a gap between the tools that people use professionally and what they use in their personal projects. If someone is working on a team, they may not personally use d3.js, but it might be the final form for all of their work – just implemented by someone else. To really get at those details, we’d need to add several more questions (and a lot more complexity) to the survey. It’s always good to keep in mind what questions you can and can’t answer from the data, and where your questions and interpretation start to run up against the limits of the information that you have, and to ask whether that changes the level of effort that you’re willing to put into exploring a particular point.
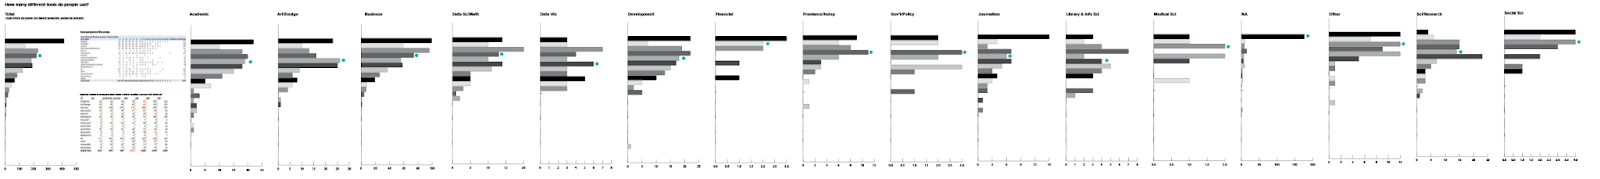
What’s the most common number of tools per profession?
Another way to get at a comparison between groups is to do a median calculation. The median bin is shown as a teal dot in each bar chart above, to give me a point of reference for making sense of the distributions. I can also go for a more aggregated view, and count up the median bins per profession to make a derivative histogram showing the median number of tools for each career. For most professions, the median falls between four and five tools, but there are a couple with medians as low as two or as high as seven tools as well. I would want to look closely at those edge cases in the final analysis, just to make sure that I don’t have a hidden n-value problem giving me unrealistic medians or otherwise skewing the results.
Do you feel how much easier it is to trust this chart, with its confident axes and labeled values? Don’t let the representation fool you: this chart is still missing at least half of my data, and that makes count comparisons meaningless at this stage. The more aggregated your representation becomes, the easier it is to miss those important caveats lurking in the details.
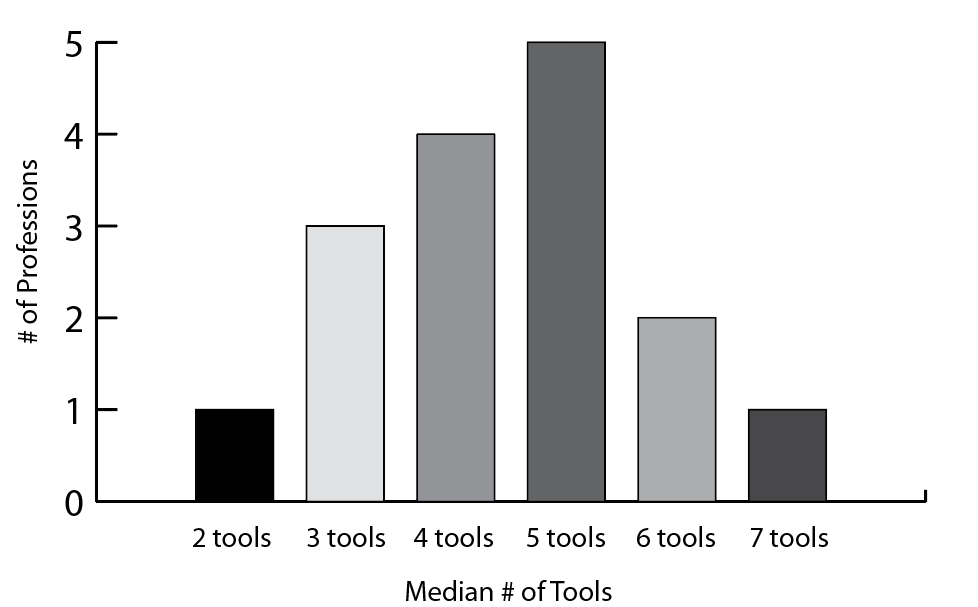
What is the median number of tools per profession?
Of course, as soon as I make this aggregated chart, I want to see which professions are in the seven tools bin, so I’d probably want to include a breakout of some kind or a supplementary view of the median value per career group if I wanted this chart to become the basis for my final analysis.
This is another chart whose interpretation is highly sensitive to n values. I’m comparing across career groups, but not paying attention to how many responses were collected for each one. Some of these “results” are based on 15 people and others are based on 700. Always keep your eye on the n values: I haven’t validated my categories here, and I’m pretty certain that at least some of my career categories will need to be merged and redefined before I include them here.
Tempting as it is to start comparing values, I have no business making any conclusions at this stage about why people in dataviz might use more tools than business, for example. I shouldn’t even start to speculate. People who are inexperienced with data analysis will often try to extrapolate from partial results and start imagining stories based on “the data” or “the trends I’m seeing,” but it’s important to completely deny that urge in the discovery phase. What you put into a chart determines the quality of insight that you get out of it, and “the data” is only as good as the analysis you’ve done. Getting over-attached to a blip in the numbers will only blind you to the more interesting information that’s really there, and it may lead you to make major mistakes.
What have we learned?
So, what exactly have I learned from doing this exploration, if I can’t trust my counts or make any conclusions based on what I’ve seen? I have:
- A set of questions to choose from, based on the final story that I decide to tell. I can pull from these later, when my core narrative begins to take shape.
- An idea of what the analysis will look like for each question.
- Notes about important things to look into, and warnings about things to avoid.
- A preliminary view into some interesting aspects of the data, and some initial observations to verify as I work through a more complete analysis:
- Some tools are quite popular, and are identified as important by almost half of survey respondents. Others have only a handful of users.
- Some tools are popular across all career groups, while others are more specialized, and common to just a few careers.
- The distribution of tools across career groups varies somewhat, but usually in frequency/count rather than presence, suggesting that there might be interesting variability within career groups that could be worth teasing out.
- Small n values complicate the analysis for several career groups, and reflect too many fine distinctions in my first attempt at manually tagging the data. I should consider excluding or merging certain categories, look for another way to improve the counts (merging in data from previous years, etc.), or consider whether these smaller groups can inform a lower-certainty, more qualitative picture.
- A list of things to consider next.
That’s a lot of information to get out of basic frequency analysis on individual data columns, but the more interesting questions for this data are going to require a bit more work. I knew that from the beginning, but starting here has helped me to get acquainted with the dataset and gives me options to consider when building my project. If the more complex comparisons don’t work out, it won’t be hard to find a new place to start. This basic sense of the data will also help me to evaluate the results that I get and to catch errors, as I wander deeper into more complicated territory.
Comparing back to my design brief, though, I can see that none of these questions has really gotten to the heart of what I’m trying to accomplish (yet). I want to understand how individual people use different tools, and how that maps onto specific skill sets within the career groups. For that, I’ll need to look deeper into the relationships between columns, and across rows. Stay tuned!
Coming up in Education:
- Questions, comments, suggestions? Feel free to reach out to education@datavisualizationsociety.org anytime to share your thoughts.
- Keep your eye out for an Education/Early career event to talk about data discovery on Saturday April 2. We’re still working out the details, but will announce more via Slack and the DVS newsletter as we get closer to the event.
- Are you a data analyst, a dataviz designer/artist or a dataviz developer/engineer? This year, the education committee is building out career portraits to help people understand what it’s like to work in these different roles. Please sign up here if you’re interested in supporting our research effort, or otherwise contributing to the project. (Note: we will be asking for additional careers in the coming months, but we’re starting with these three first. If this isn’t you, hold tight!)
- Do you have experience in determining statistical significance for survey datasets collected without a control series? The tools visualization is one step in a larger project to map out career portraits using our survey data, and we need to get a sense of how big the variation between groups should be to count as real. We have our initial n values summarized and the basic analysis is done, but we could use some help getting the stats right and assessing feasibility for the more complicated comparisons. Please reach out to education@datavisualizationsociety.org if you know how to help.
- Interested in joining the education committee? Applications are now open…let us know how you’d like to get involved!

Erica Gunn is a data visualization designer at one of the largest clinical trial data companies in the world. She creates information ecosystems that help clients to understand their data better and to access it in more intuitive and useful ways. She received her MFA in information design from Northeastern University in 2017. In a previous life, Erica was a research scientist and college chemistry professor. You can connect with her on Twitter @EricaGunn.
- Erica Gunn

- Erica Gunn

- Erica Gunn

- Erica Gunn


